Kyle Ledbetter
Product
5
min read

Our most requested feature is here. And it's our biggest release since day one.
For nearly a year, Dreambase has helped you generate AI-powered analytics snapshot reports with summaries, insights, and supporting visualizations from your Supabase data. These reports answered questions and helped you understand what was happening in your product.
But you kept asking for more. You wanted live dashboards. Real-time filtering. The ability to iterate and refine. Production-grade analytics you could rely on every day.
We heard you. Today we're shipping Dashboards, and we refactored the entire product to make them possible.
AI-Native Dashboards
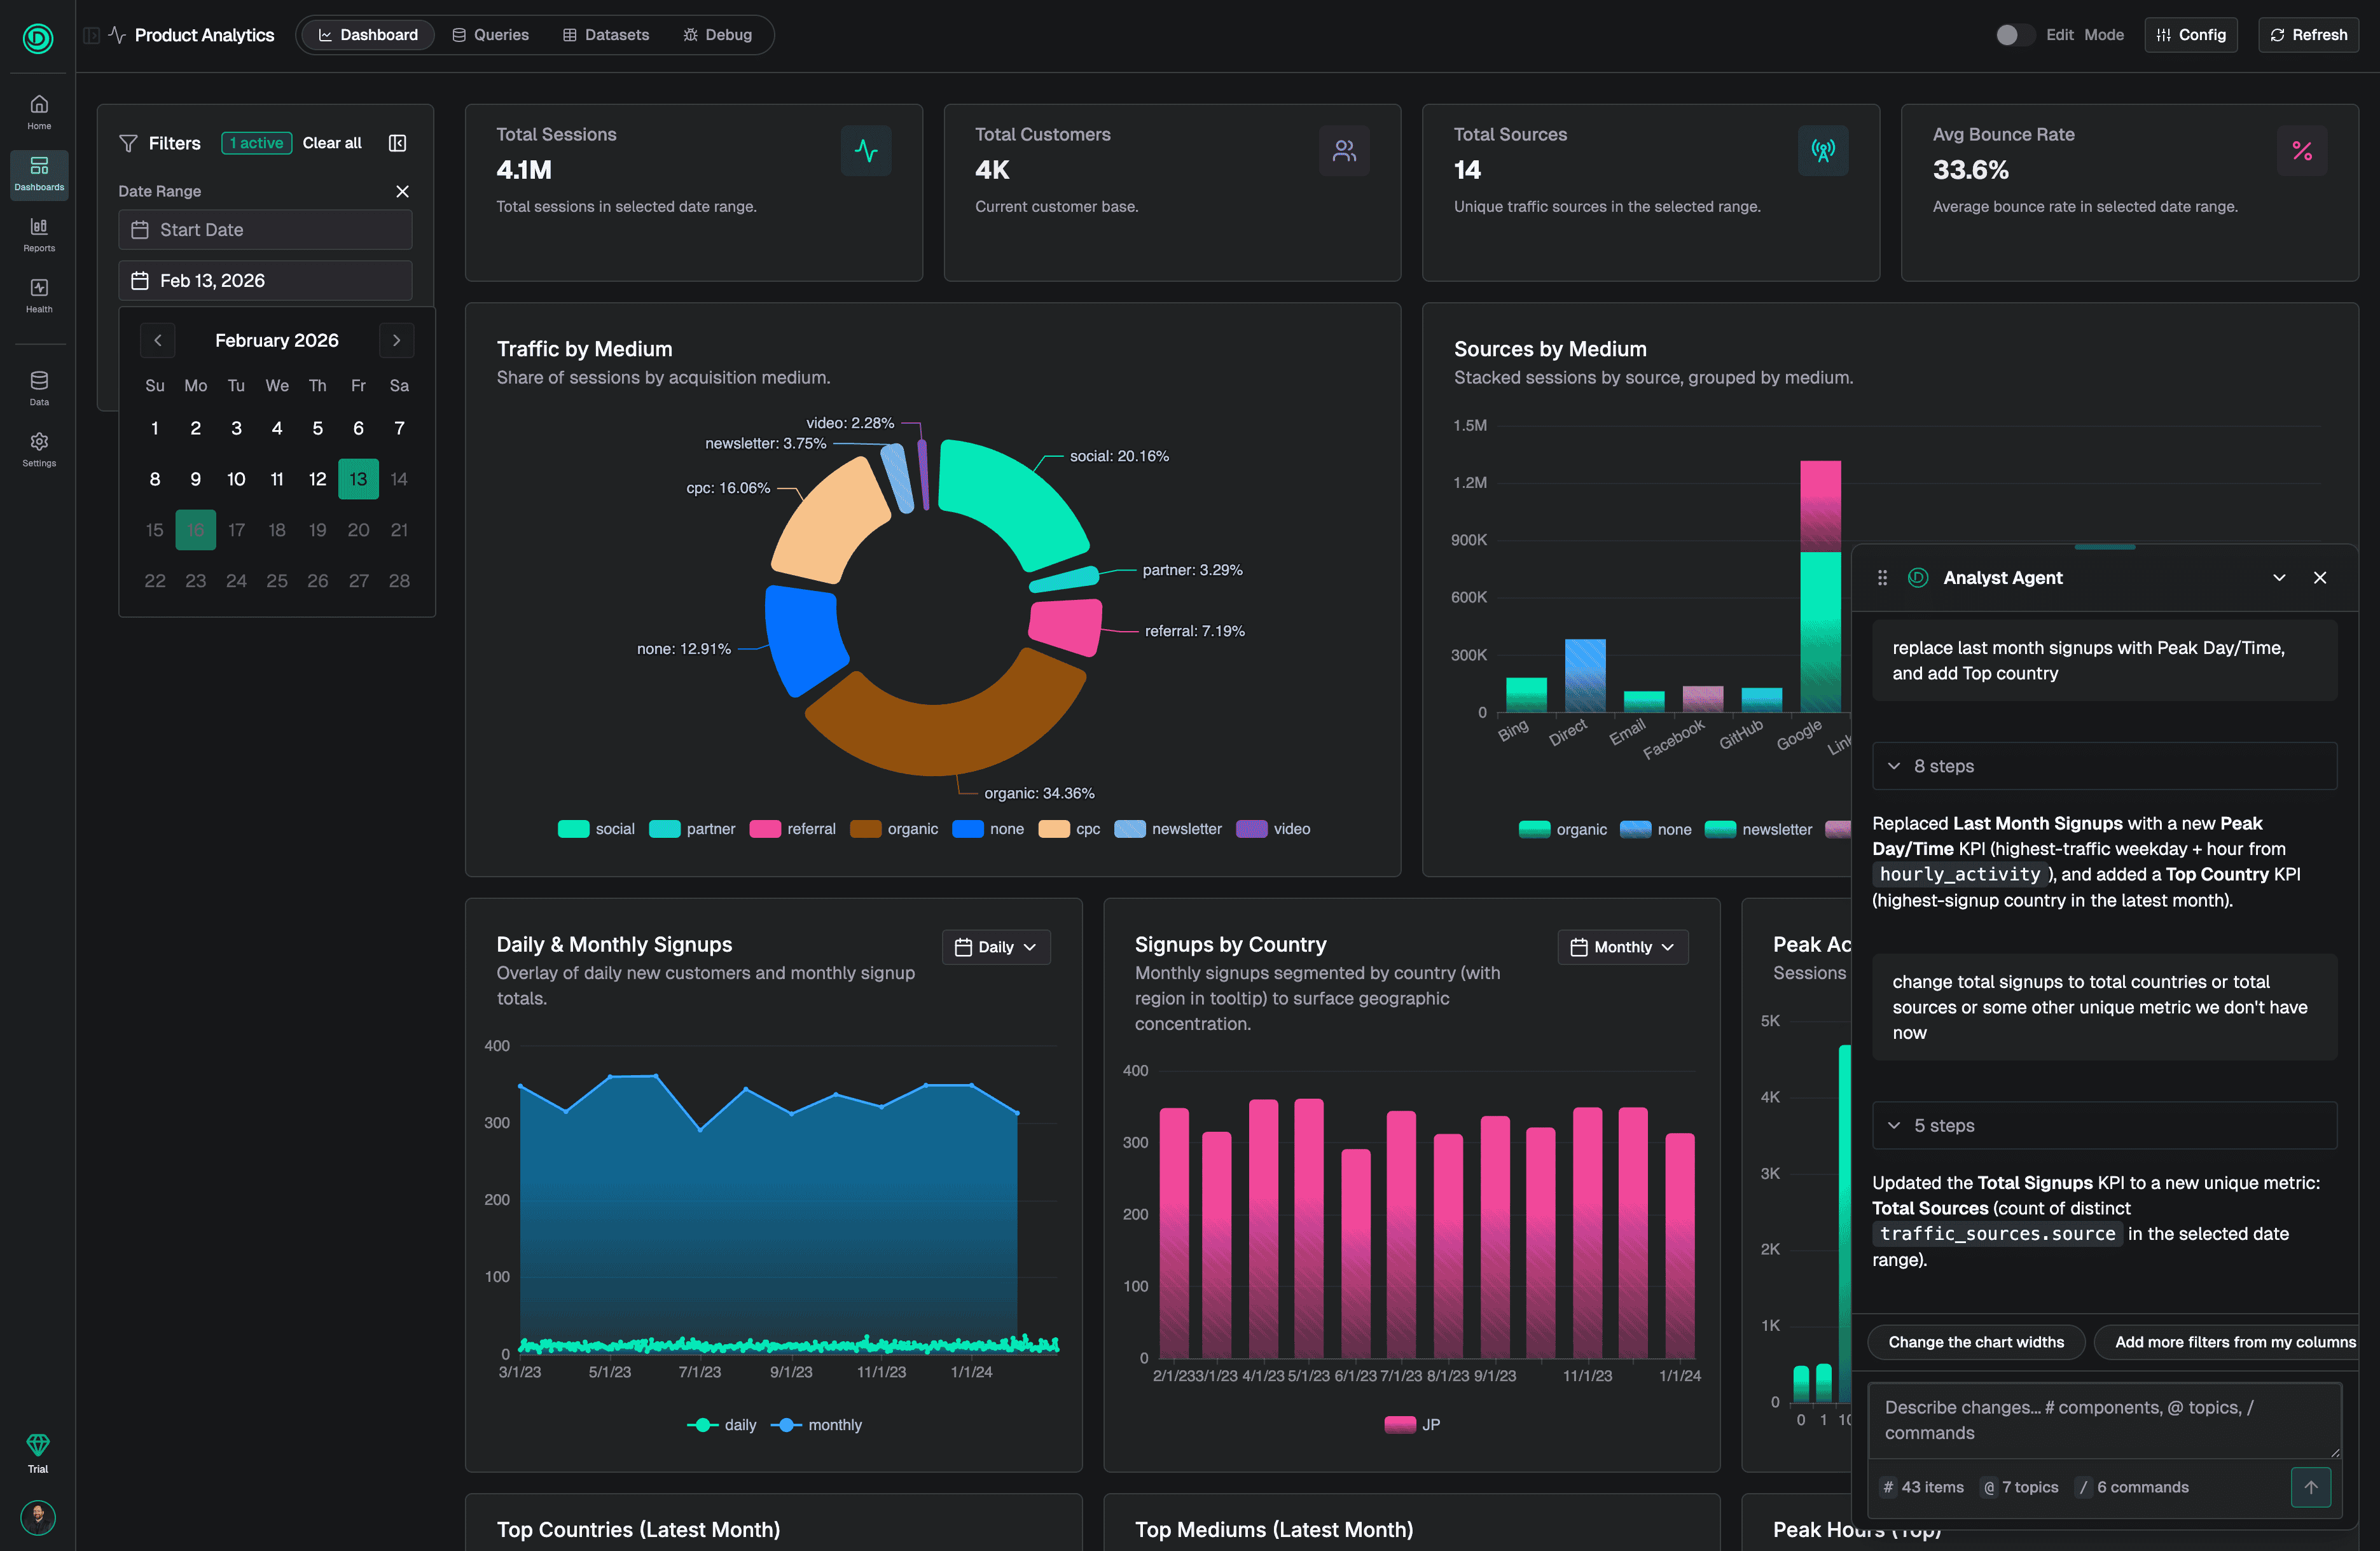
These aren't static reports. They're true production dashboards with everything you'd expect from enterprise analytics tools, built specifically for Supabase.
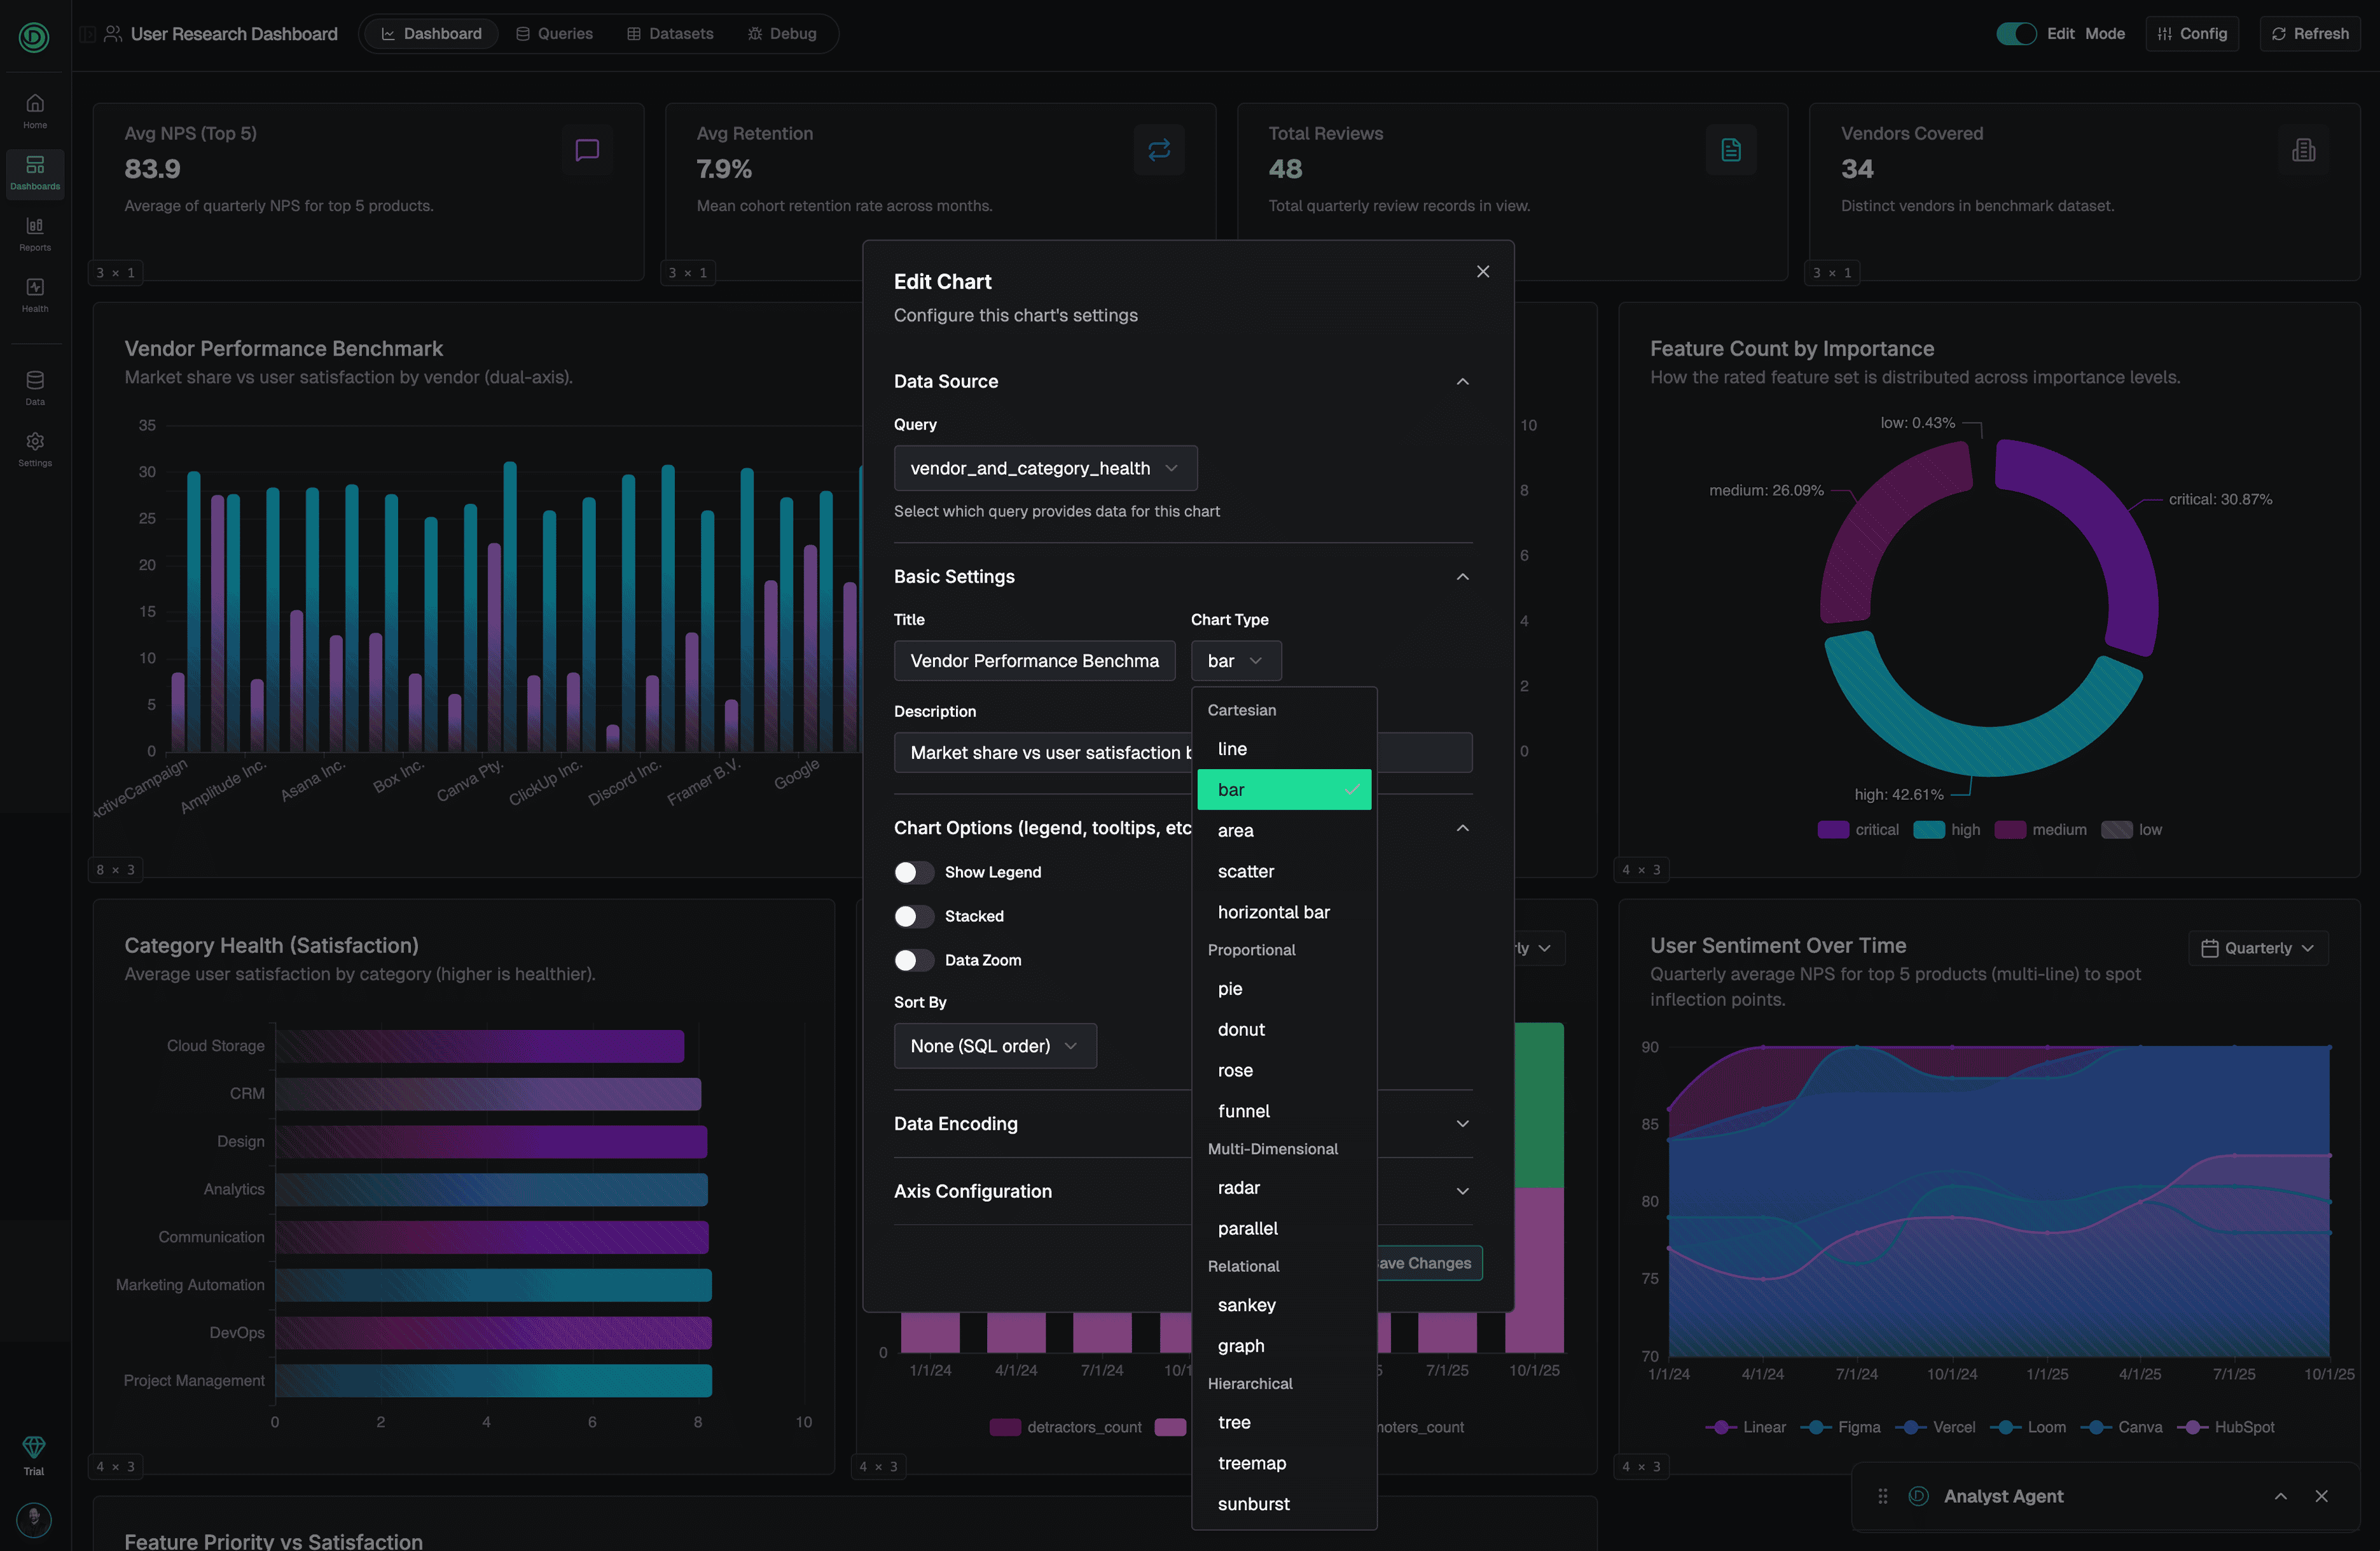
Fully interactive editing experience
Drag, resize, rearrange. Add new visualizations. Adjust queries. The dashboard updates in real-time as you build.
Proper filtering that actually works
Filter by date range, user segment, product feature, or any dimension in your data. Filters apply across the entire dashboard. No more generating separate reports for different time periods.
New AI assistant for refinement
The AI doesn't just generate the dashboard once and disappear. It stays with you. Ask it to adjust a query, add a new metric, change a visualization type. It understands the context of what you're building and helps you iterate.
Intelligent query and dataset caching
Here's where it gets interesting. Dashboards save query results directly in your Supabase database with scheduled automatic refresh. This means your production database isn't getting hammered every time someone loads a dashboard. Queries run on a schedule you control, data gets cached, and your dashboard loads instantly from the cached dataset. Better performance. Lower costs. No impact on your production workload.
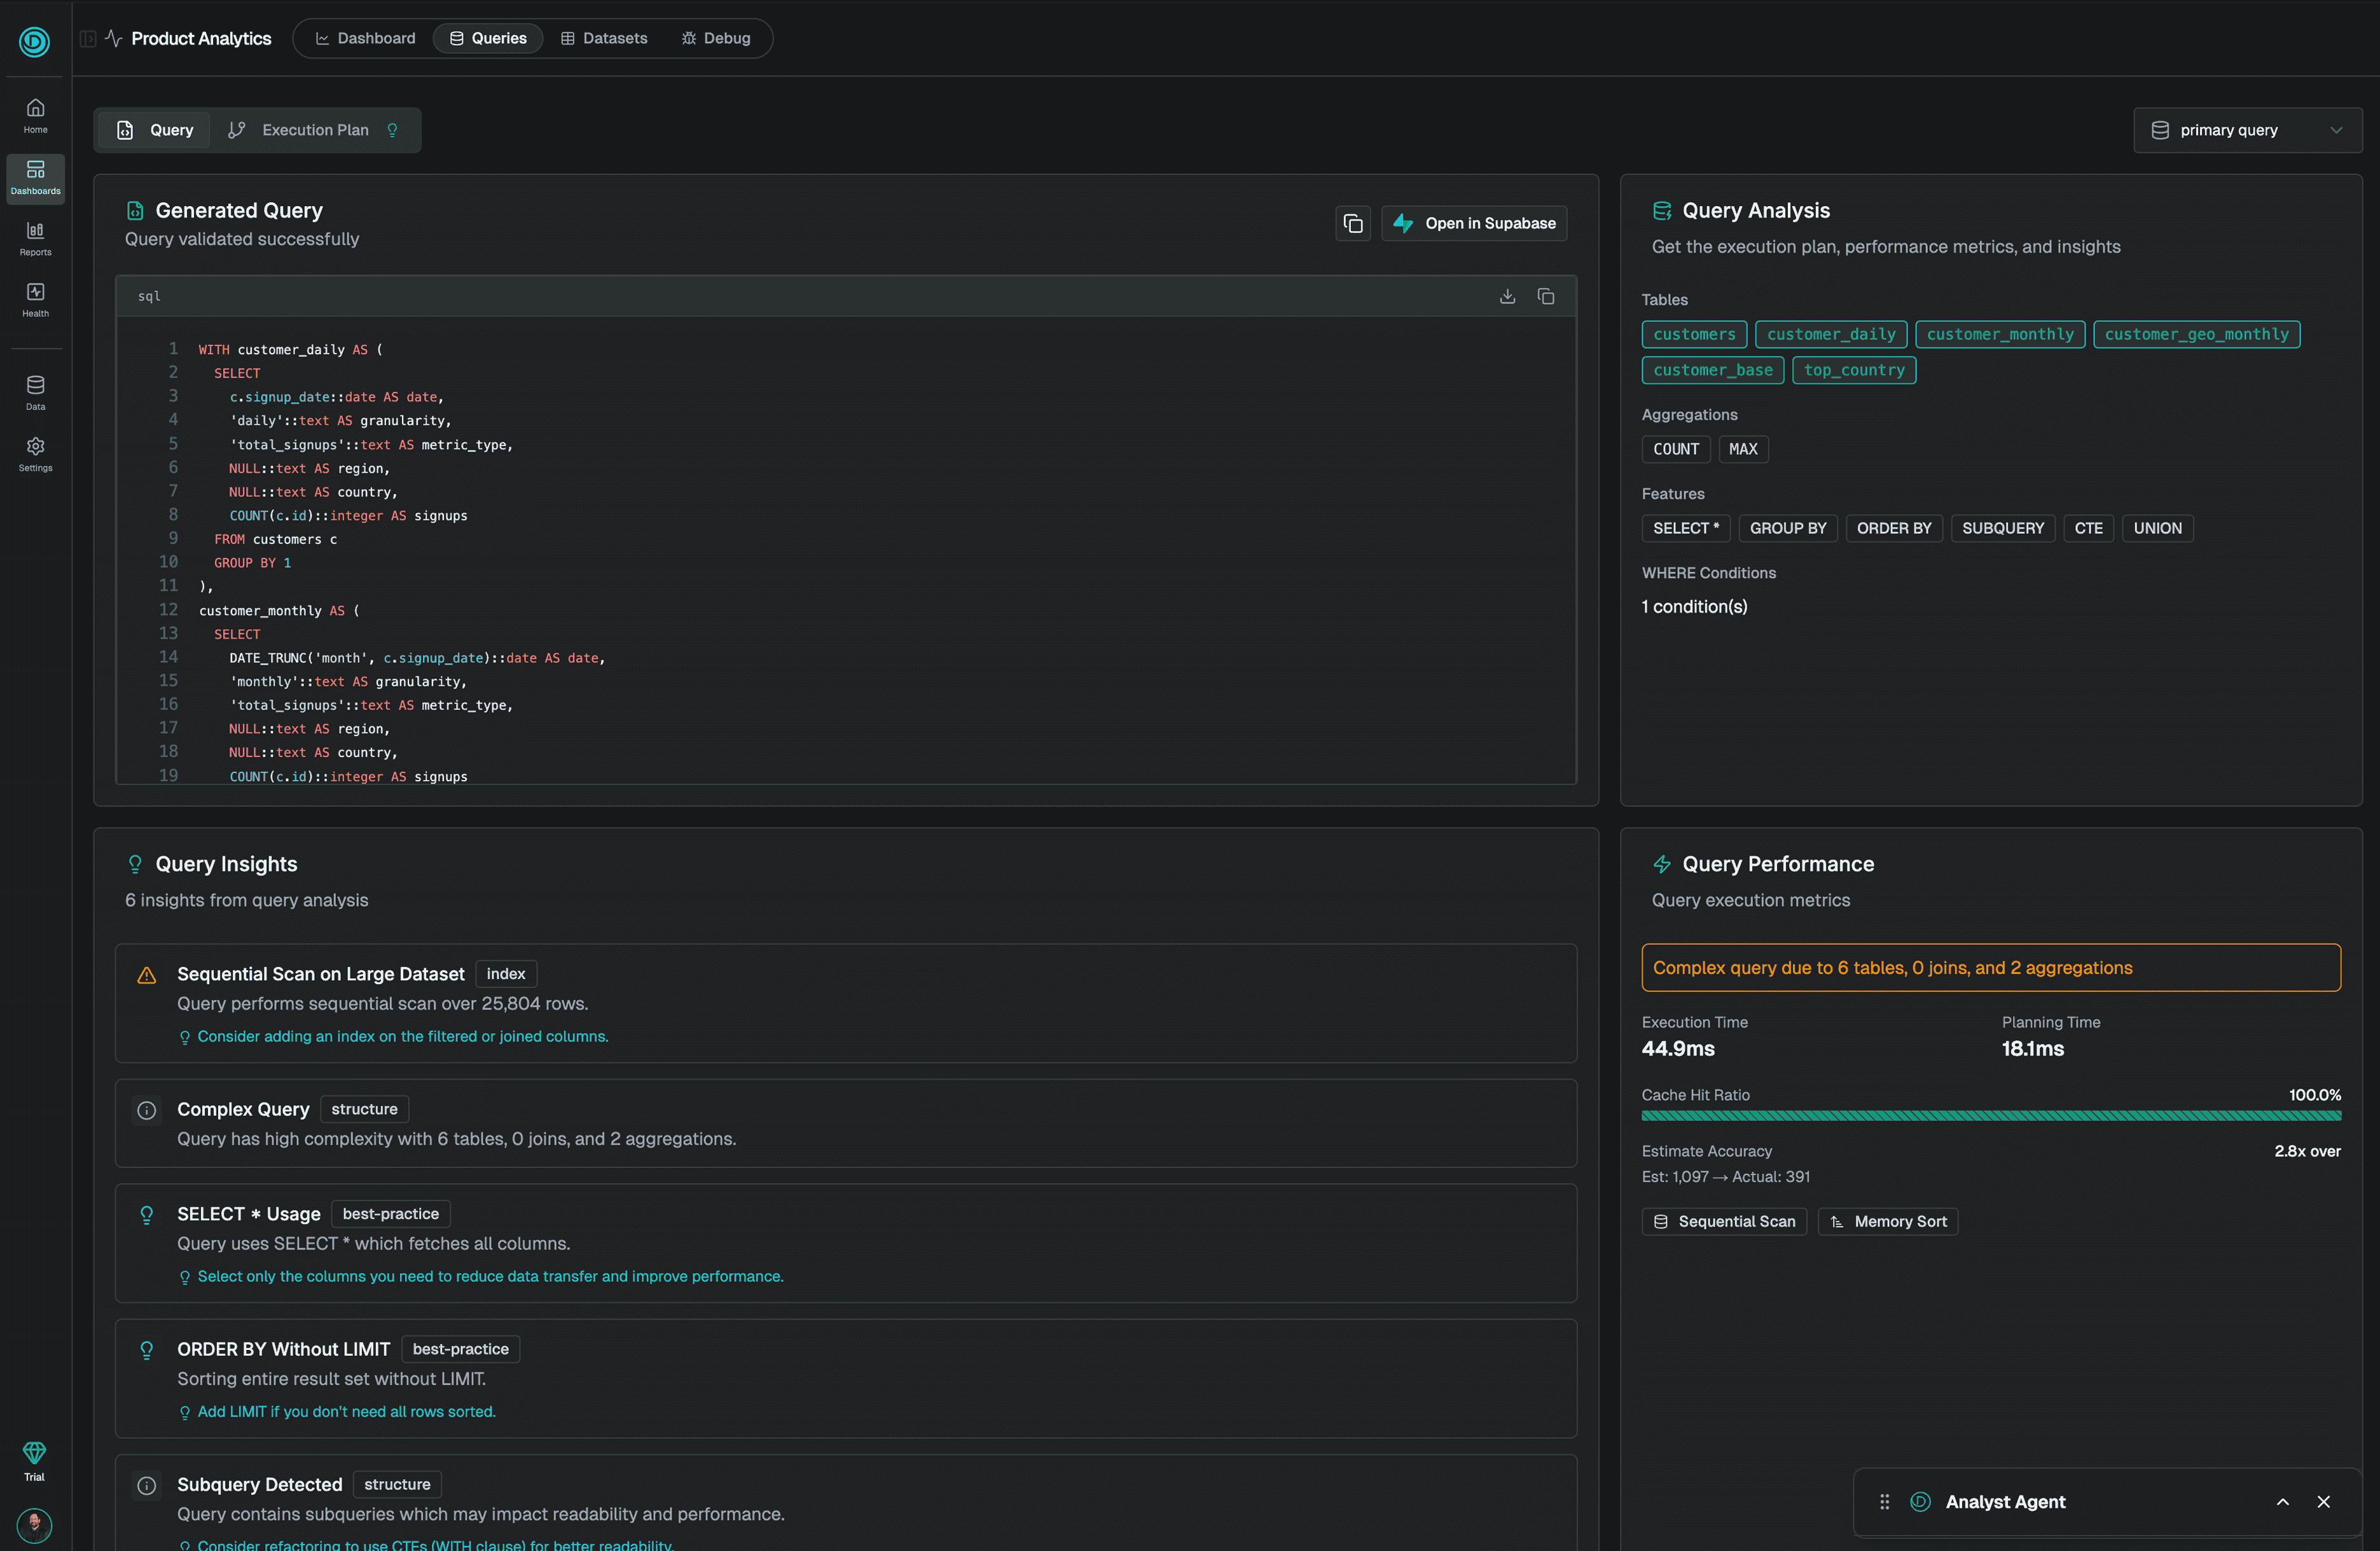
Query and dataset analysis
We built on our Supabase Health Assessments to analyze the queries and datasets powering your dashboards. You'll see explanations of what each query does, how it performs, and recommendations for optimization. Full transparency into how your dashboards work.
Background generation
Dashboards can take a few minutes to generate, especially for complex data models. Now they run in the background. Close the tab, go do something else, come back when it's done. No more sitting there watching a loading spinner.
Powered by an all new Data Catalog
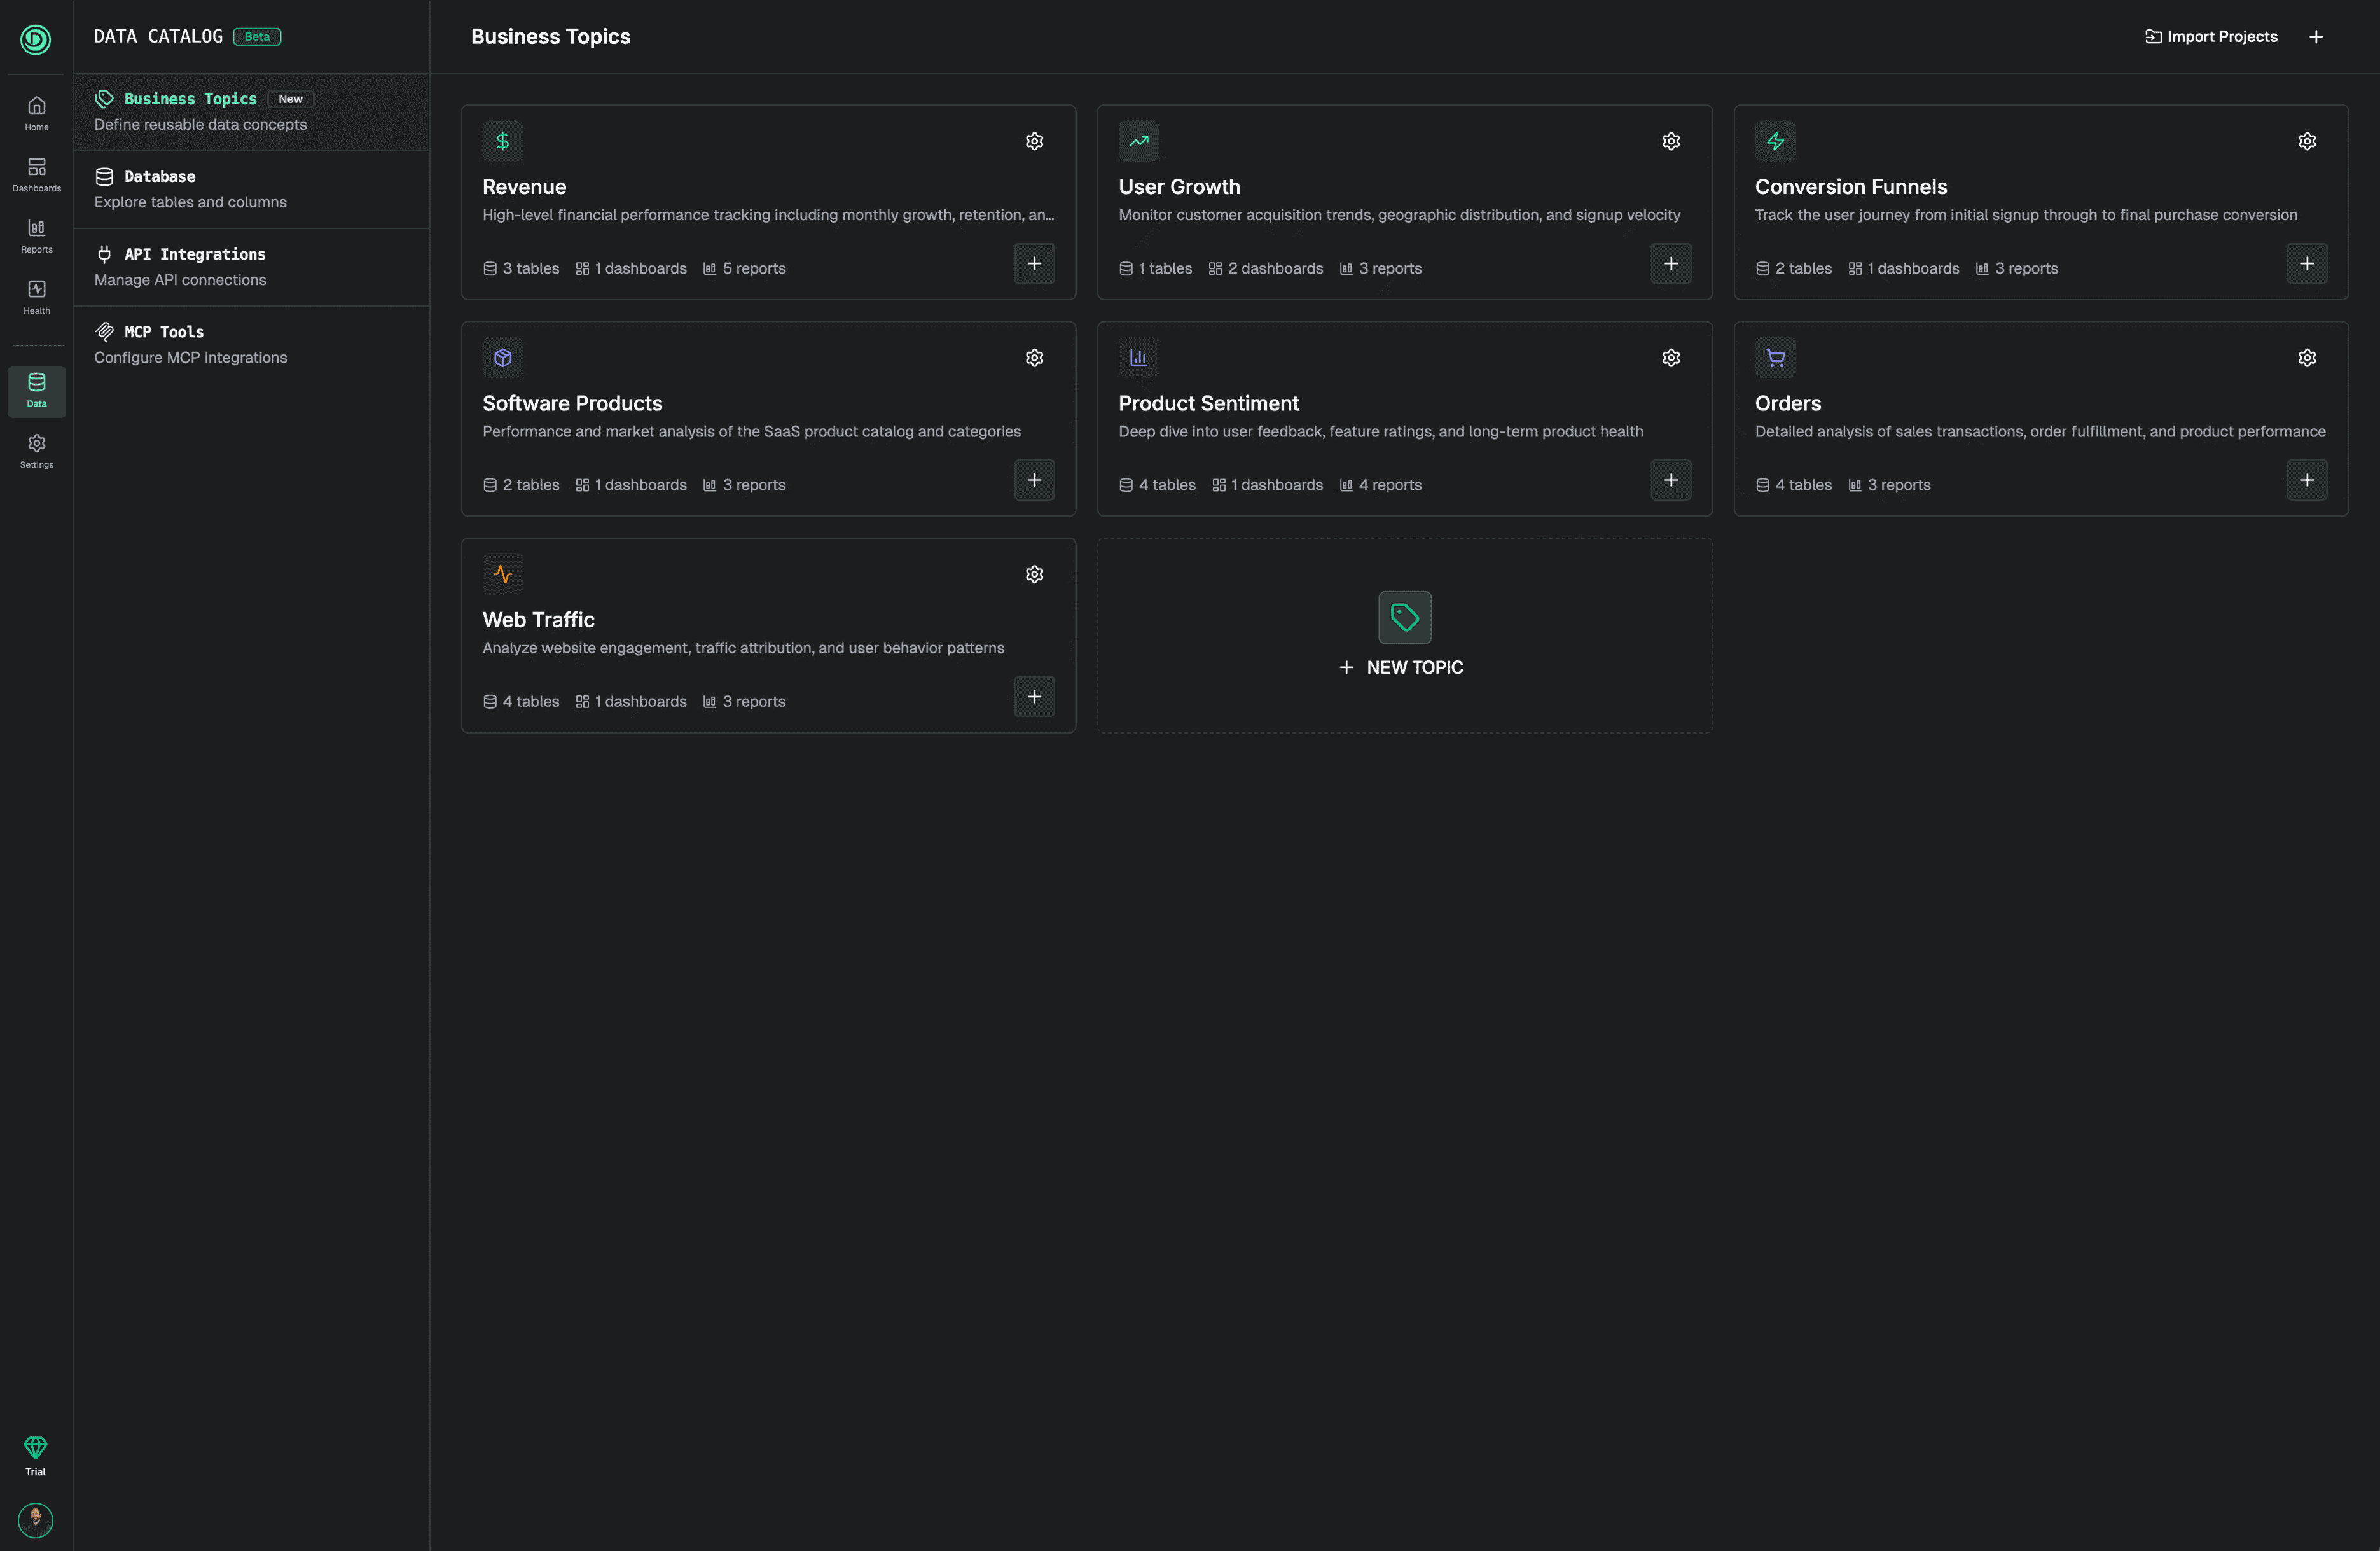
We heard consistent feedback that "Projects" were confusing. You had to create a project before generating reports, and it wasn't clear why or what they were for.
We've replaced Projects with something much better: the Data Dictionary and Topics.
This is your AI-native semantic layer. Instead of teaching the AI about your data model every single time, you define it once in Topics.
Topics are reusable, one-to-many scopes that map your tables and data sources to your custom KPIs, metrics, and business concepts. Define "User Engagement" once with the tables, metrics, and business logic that matter. Then use that Topic across multiple dashboards and reports.
The AI understands your Topics and uses them to generate accurate queries every time. No more re-explaining what "active users" means. No more inconsistent metric definitions across different reports.
This is the foundation for truly scalable AI-native analytics.
A Completely New Experience
Dashboards required rethinking the entire product. So we rebuilt the UI from scratch.
New navigation rail
Cleaner, faster, more intuitive. Everything you need is one click away.
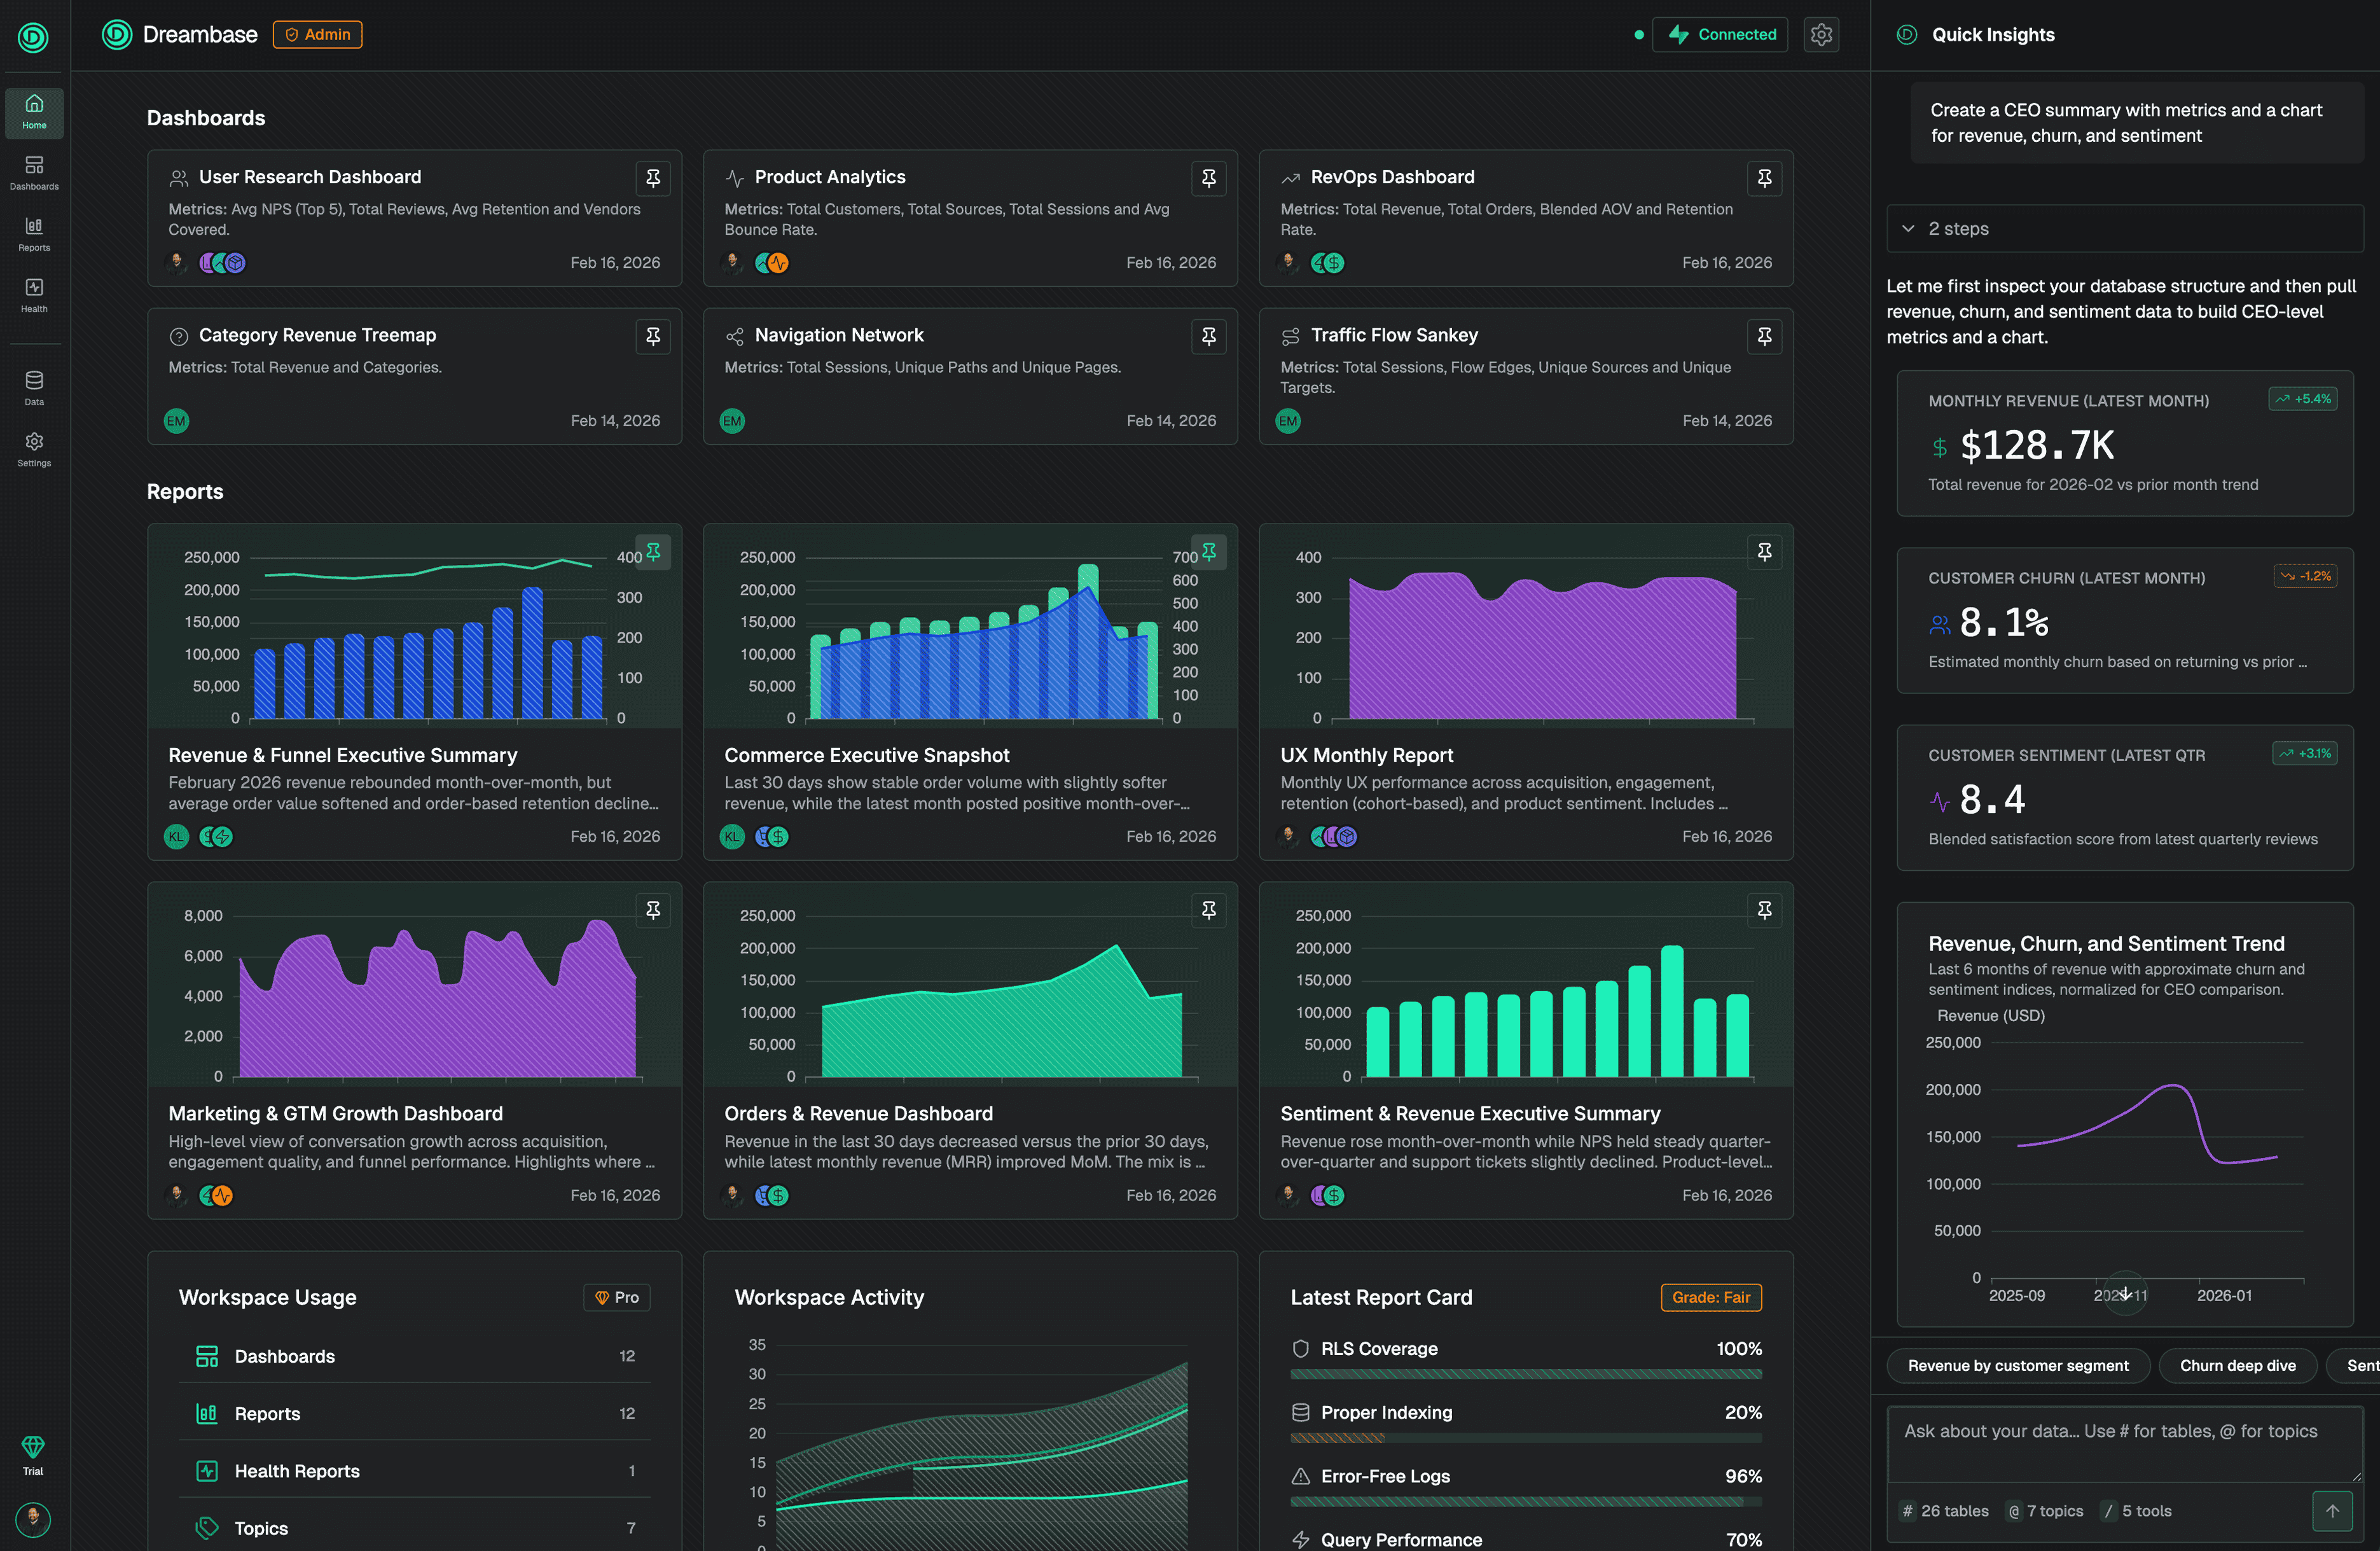
All-new homepage
Your workspace opens to a new AI assistant for quick insights. Ask a question, get instant metrics and charts. No need to create a full dashboard for quick exploration.
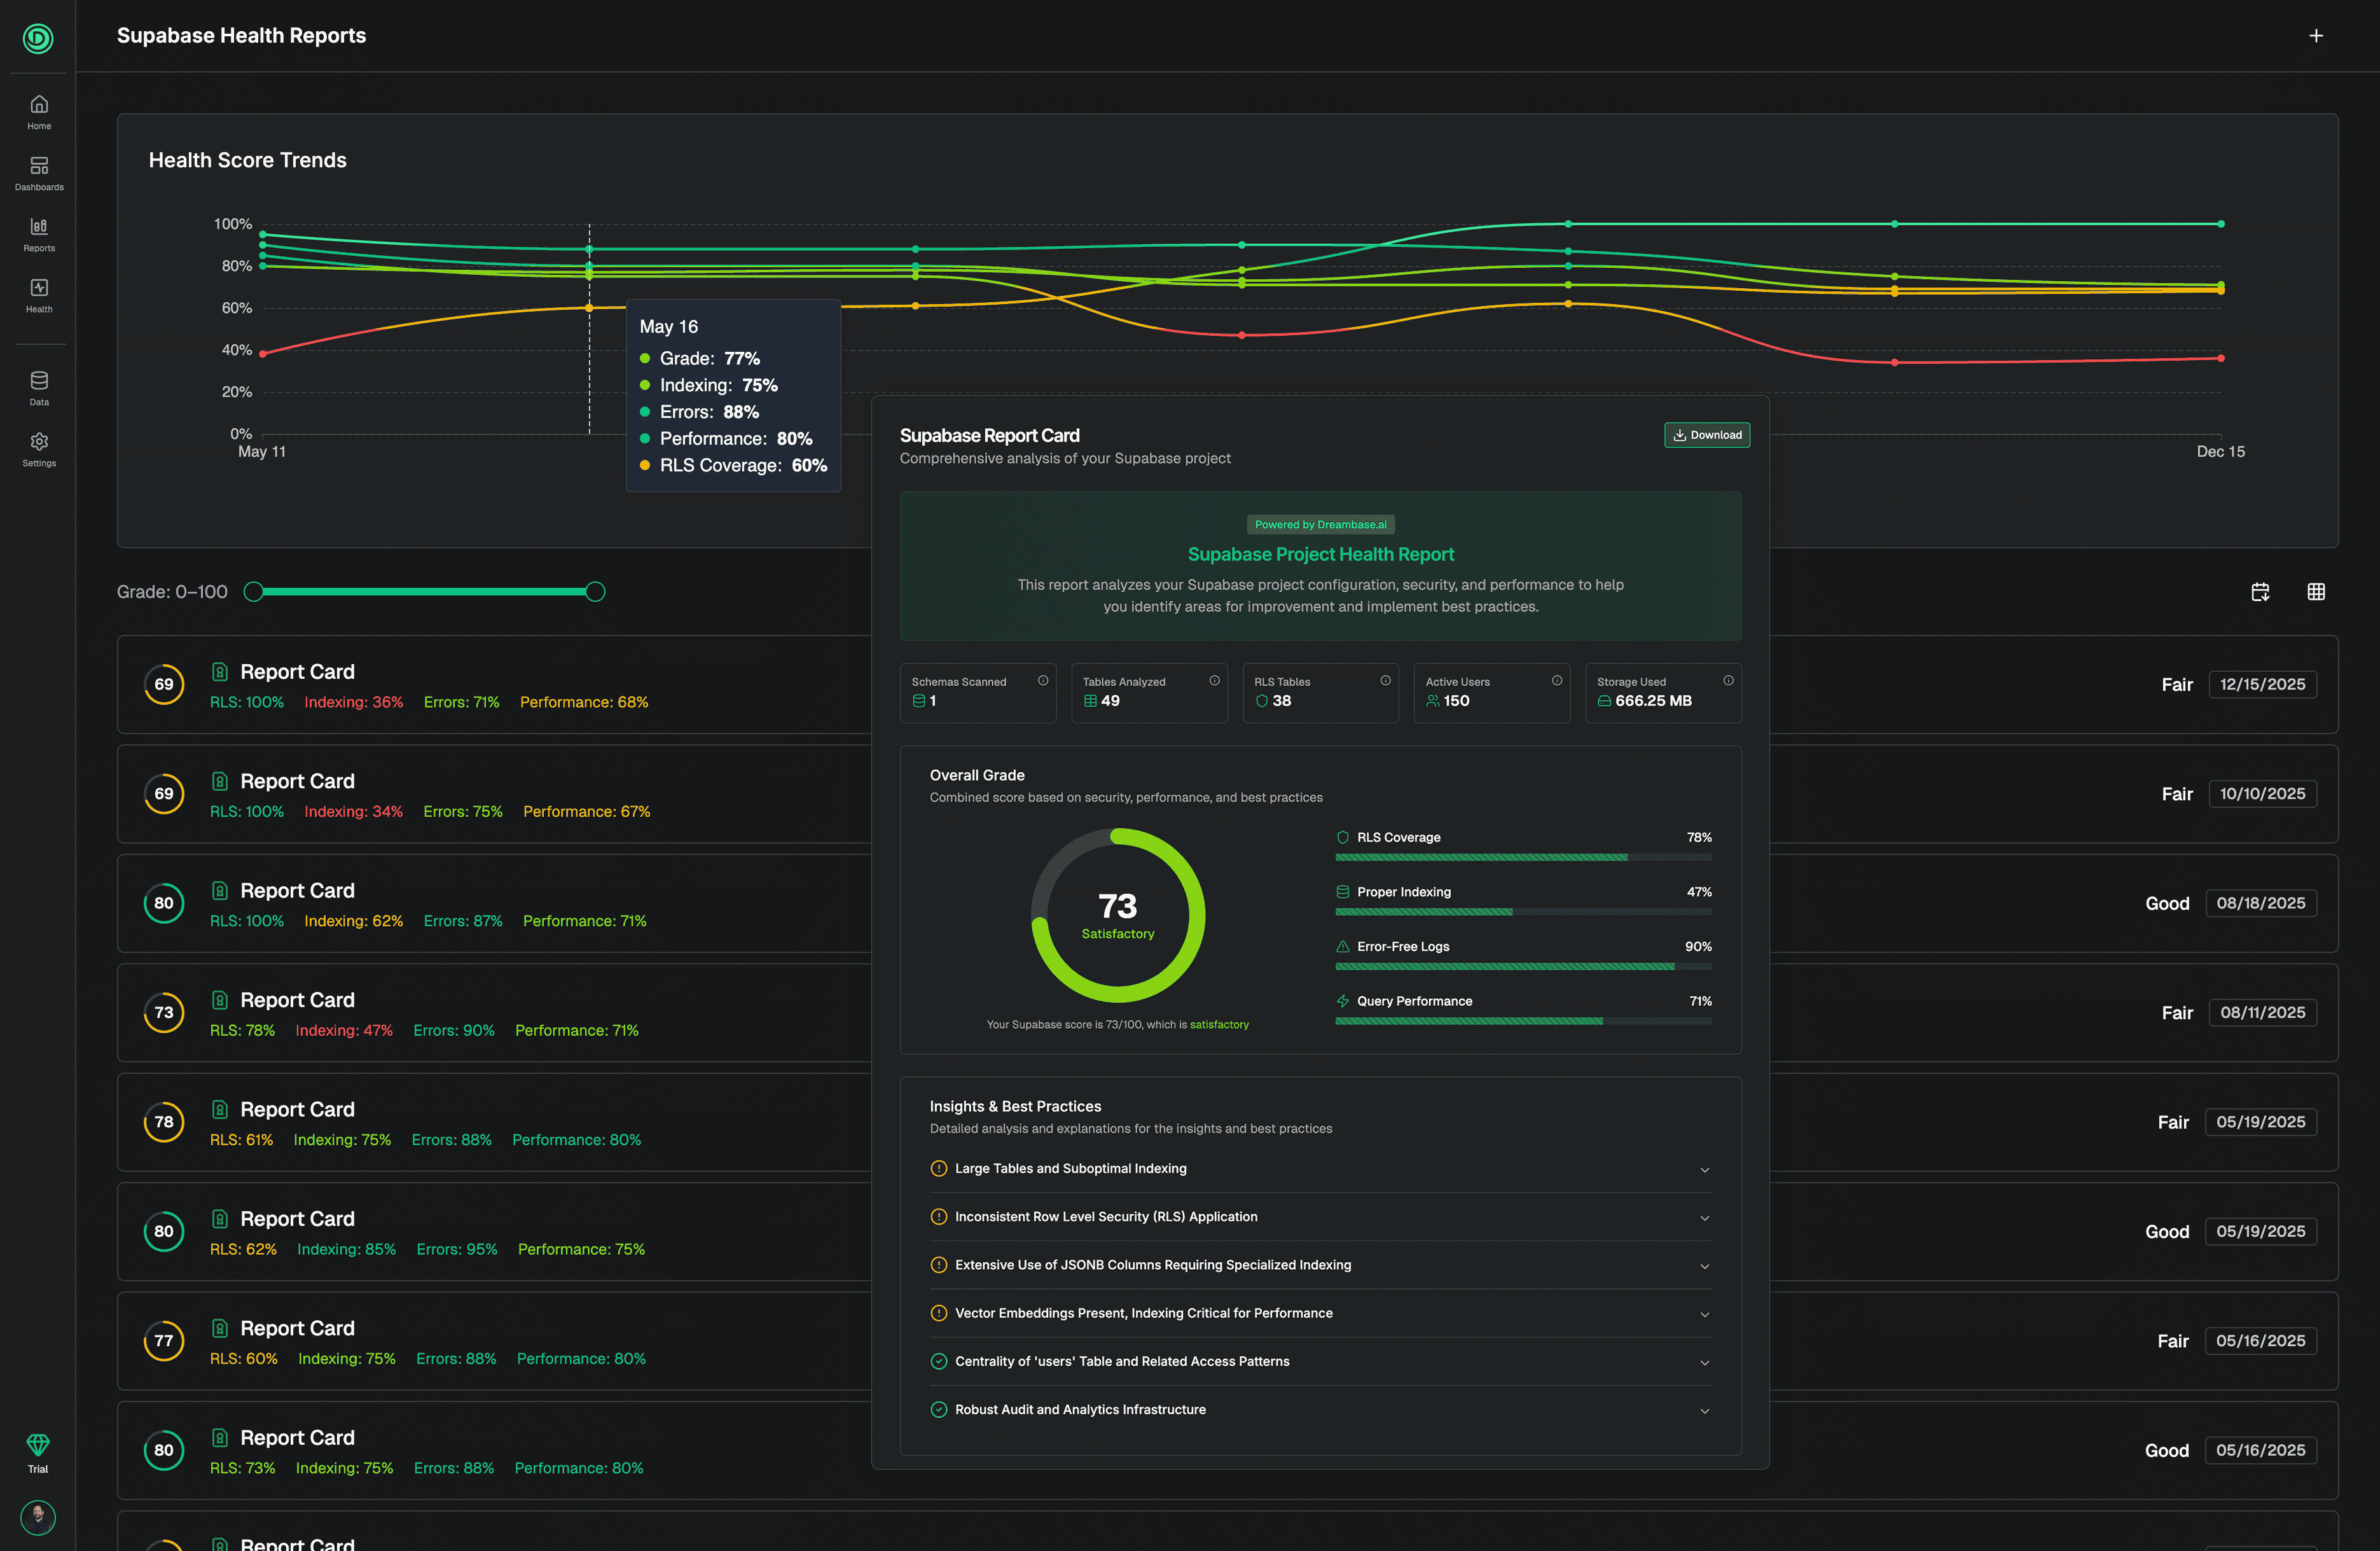
Refreshed Supabase Health Assessments
We didn't forget about database health. Health Assessments now include a top-level benchmarking view so you can track your database improvements over time. See how your scores change as you implement our recommendations and fixes. Continuous improvement, measured.
Still Completely Free to Try
Despite this being our biggest release ever, we're still offering a completely free trial. No credit card required.
Connect your Supabase project, explore the new experience, generate your first dashboard. See what production-ready AI-native analytics actually looks like.
What's Next
We're not done. Reports are about to evolve.
Right now, Reports are AI-generated summaries with charts and insights. They're great for exploration and answering specific questions. But we're transforming them into something more focused: executive summaries of actionable insights and ad-hoc exploration.
And they'll arrive in Slack and your inbox. You won't need to log into Dreambase to stay informed. The insights will come to you, where you already work.
More on that soon…
Try Dashboards Today!
This is the release we've been building toward since we started Dreambase. Production-ready, AI-native analytics for Supabase. With the semantic layer, caching system, and interactive experience you've been asking for.
Build fast. Build right. Now you can monitor and measure at the same velocity.
Ready to witness a new world in AI-native analytics where YOU take the driver's seat?