Kyle Ledbetter
Product
4
min read

Dashboards run your business. Reports answer your questions. We just made the difference crystal clear.
When we shipped Dashboards last month, we fundamentally changed what Dreambase is. Dashboards became the production layer: the live, always-on view of your business that your whole team runs on every day.
That left Reports in an interesting place. If dashboards handle the ongoing monitoring, what should a report actually be?
We went back to the drawing board. And what came out is something we're genuinely excited about.
TL;DR: Reports are completely overhauled, try it now! Generate Your First Report →
Reports Are Now Ad-Hoc Executive Summaries
Reports are no longer static documents with charts attached. They're ad-hoc executive summaries: intelligent, insight-driven responses to a specific question, moment, or business need.
Think of the difference this way:
Dashboards are what you check every morning. Live data, always current, always running in the background.
Reports are what you generate when something specific needs to be communicated. A board update. An investor email. A team all-hands. A weekly summary for a stakeholder who doesn't log into Dreambase.
Reports pull from your Supabase data and enrich it with external MCPs and APIs, so you can combine product metrics with revenue data, CRM context, or any other source you've connected. The result is a complete, contextual executive summary, not just a chart dump.
New Layouts: Insights-First, Built to Share
We completely overhauled the report layouts with one goal: make every report immediately shareable and useful without any formatting work on your end.
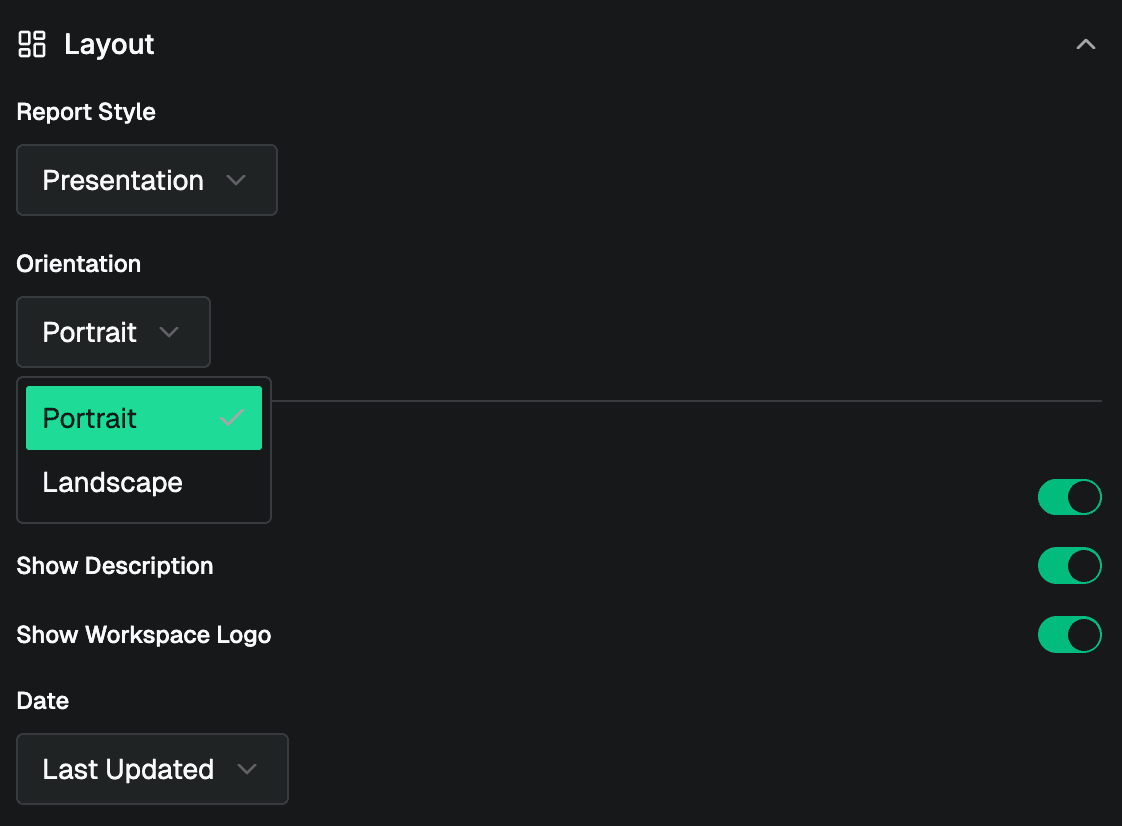
Portrait layout is designed for executive summaries, investor emails, and documents you'd send or print. Clean, scannable, insight-forward.
Landscape layout is designed for presentation slides, board decks, and all-hands screens. The same insights, formatted for a room.
Both layouts are insights-centric. The AI leads with what matters, not with raw data. Every report is shareable with a public link the moment it's generated.
No more copying charts into slides. No more reformatting exports. Generate the report, share the link, done.
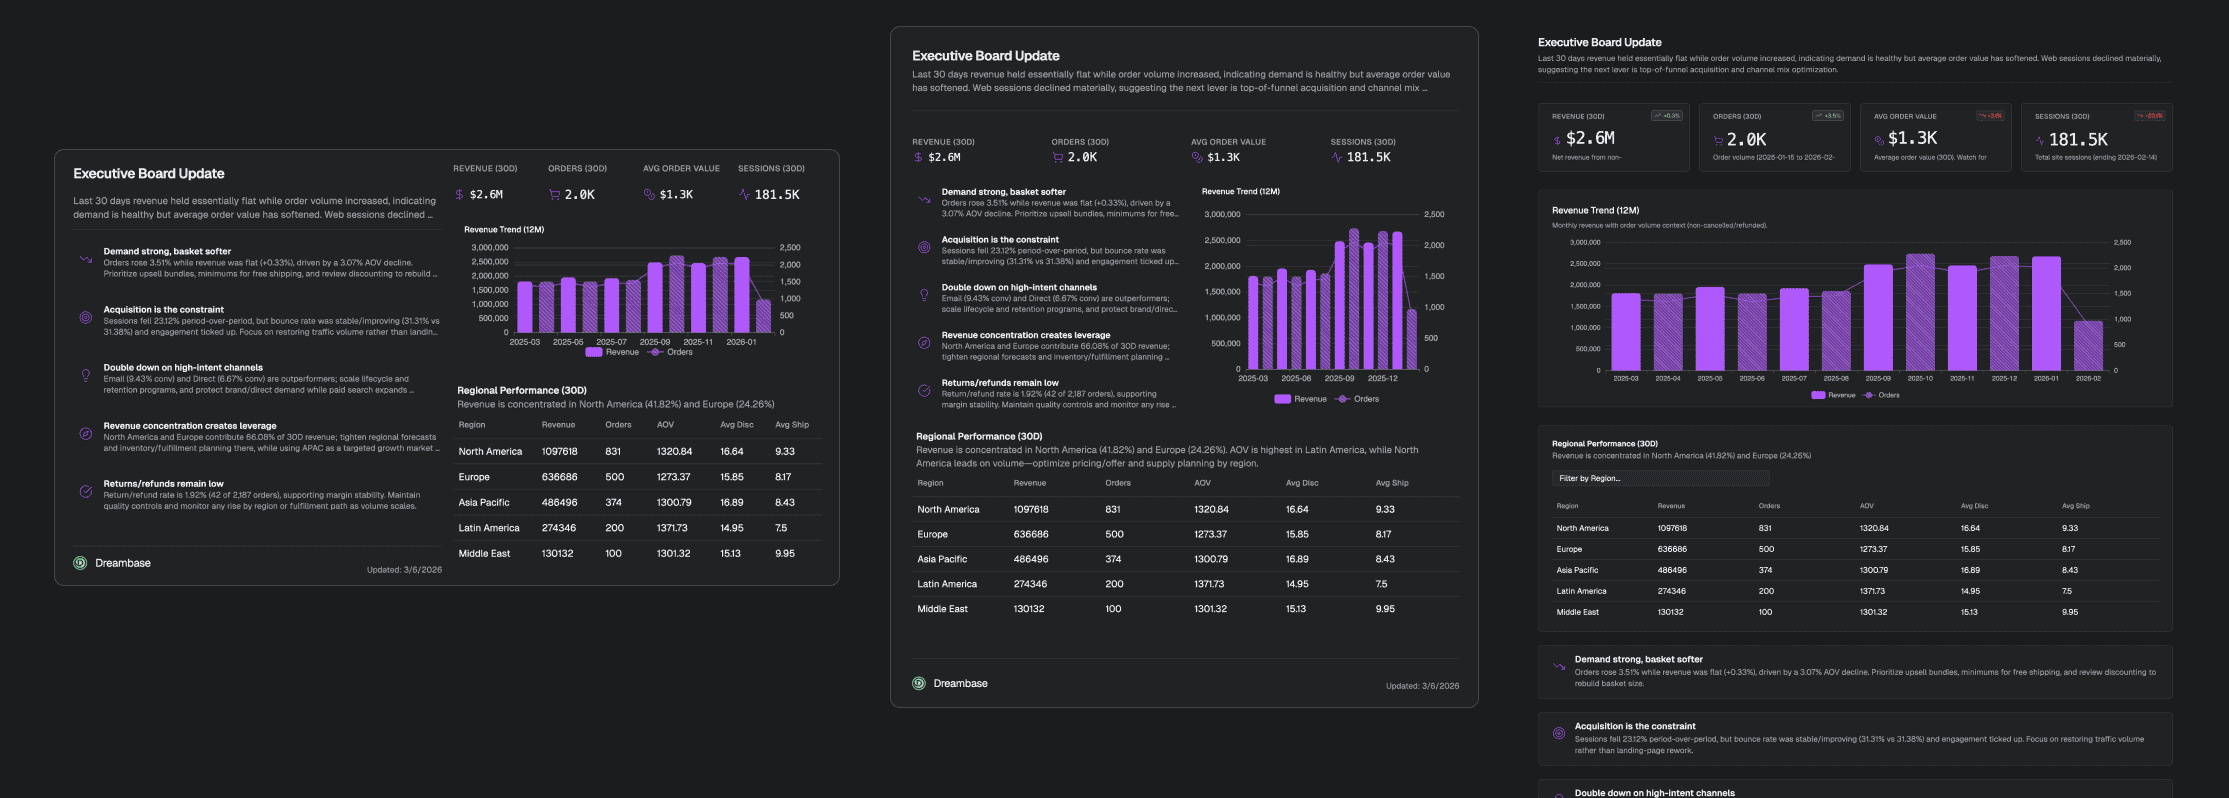
We also have "Card Grid" is the new name for the previous more dashboard looking layout.
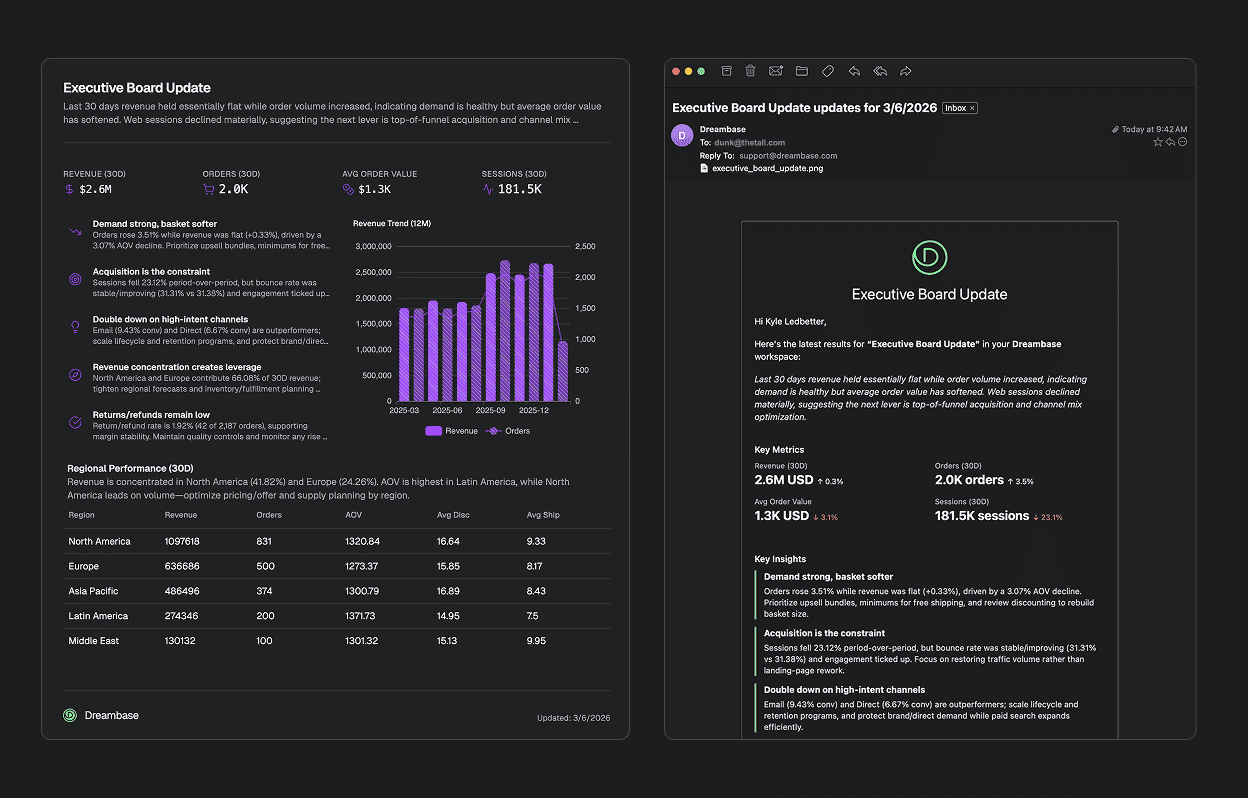
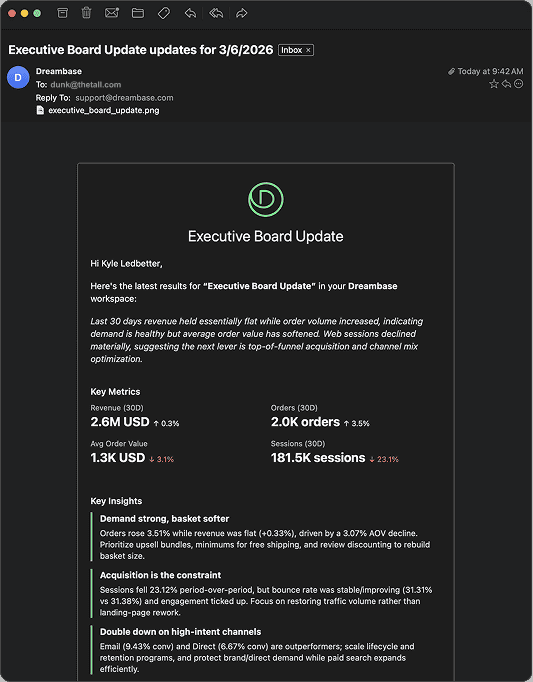
Insights in Your Inbox
Here's the feature that changes the day-to-day experience the most: report insights now arrive in your inbox the moment generation finishes.
You don't need to watch a browser tab. You don't need to check back. You kick off a report, close the tab, go do something useful, and the summary lands in your email when it's ready.
This is what AI-native analytics should feel like. The insight comes to you. You don't go looking for it.
The email isn't a notification that says "your report is ready, click here." It's the actual insights. The key takeaways from the report, surfaced directly in your inbox so you can act on them immediately or forward them to whoever needs to see them.
Dashboard AI Assistant Upgrades
We also significantly upgraded the Dashboard AI Assistant with a bigger, smarter context window. Longer conversations. More useful follow-up questions. Better memory of what you've already discussed in a session.
If you've ever hit the point in an AI chat where it seems to forget what you were talking about earlier, this update is for you. The assistant now holds more context, which means more productive back-and-forth when you're refining a dashboard or digging into a specific metric.
MCP and API Reliability Upgrades
Under the hood, we've significantly improved MCP and API integrations across both Reports and Workspace Chat. More reliable connections, better error handling, and faster response times when pulling external data into your reports.
If you've connected CRM data, billing APIs, or external MCP servers to Dreambase, you'll notice the difference immediately.
The Bigger Picture
We're moving toward a world where your analytics come to you, not the other way around.
Dashboards run in the background, always current, always available when you open Dreambase. Reports generate in the background and land in your inbox. The Workspace Chat AI assistant on your homepage answers questions instantly without creating a full report or dashboard.
You shouldn't have to go looking for insights. They should surface where you already are, whether that's Dreambase, your email, or eventually your Slack.
That's the direction we're building toward. Today's release is another step.
Try It Now
All of these updates are live now for all Dreambase users. If you haven't tried Reports since the Dashboards release, now is the right time. The experience is completely different.
Ready to witness a new world in AI-native analytics where YOU take the driver's seat?