
Kyle Ledbetter
Product
5
min read

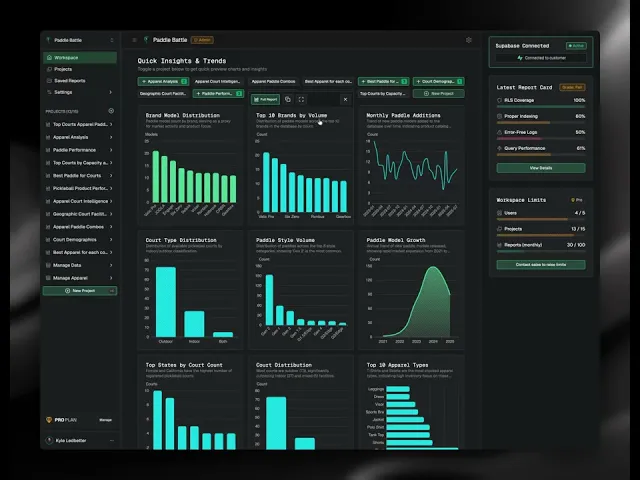
Introducing Quick Insights and Trends
Quick Insights and Trends is an all new incredibly powerful feature that allows you to generate insights and trends in seconds directly from their Supabase data in their Dreambase dashboard. It will change the way your interact with your data by surfacing the most important metrics and trends in your data, allowing you to quickly understand the health and performance of your business and drill down into the details of any metric or trend for a full blown product analytics report.
Our First AI Experience Evolution: Moving from chats to reports
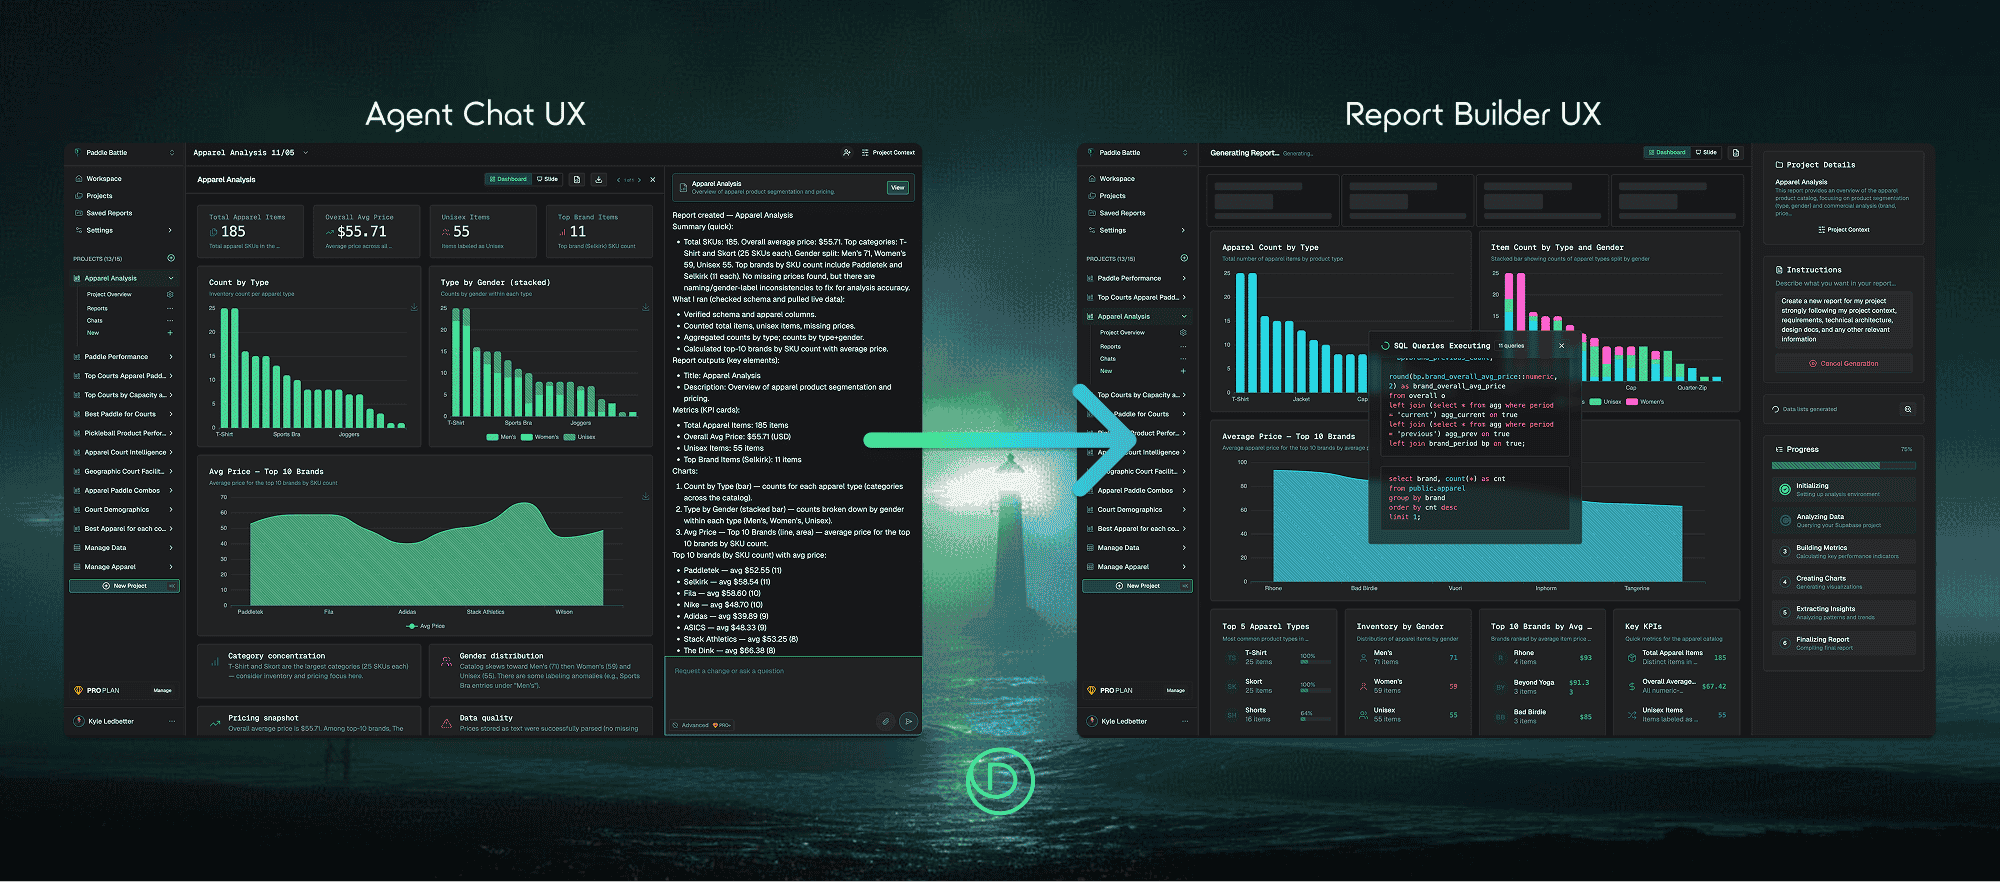
Our first AI-driven experience goal was to push the user interaction out of the chat interface. While chatting with AI using natural language is a powerful way to interact with data, it's not the only way. We wanted to create a more direct and efficient way to interact with data. So we build the report builder experience, our first innovative AI-driven experience that allowed users to build product analytics reports in seconds without needing to talk to an AI agent or know any SQL.
The Unlock: Inspiration from Supabase Select
While Andy and I were in San Francisco for Supabase Select, we were reflecting on the lineage of Dreambase and how it has already changed how our users interact with their product data in Supabase. As AI allows new technical capabilities to shortcut traditional analytics patterns, removing the need for data silos, data movement, knowing SQL, and other traditional analytics hurdles tools like MCP allow, this unlock provides the same affordances for shifts in interaction and user experience patterns.
We were standing in the middle of Dolores Park brainstorming and joking about new ways we could let our users interact with product data and visualizations. One of us came up wild idea we nicknamed "Visualizations Hot or Not": where users could swipe through rapidly generated charts and choose the best one for their report. After we laughed about it for a bit, we realized it actually might be a useful feature to not have to wait for a full product report if you're just looking for a quick insight or trend.
Here's a pretty hilarious recreation of that moment in Dolores Park:

here's a real pic from Supabase Select:

Our Second AI Experience Evolution: Moving from reports to insights
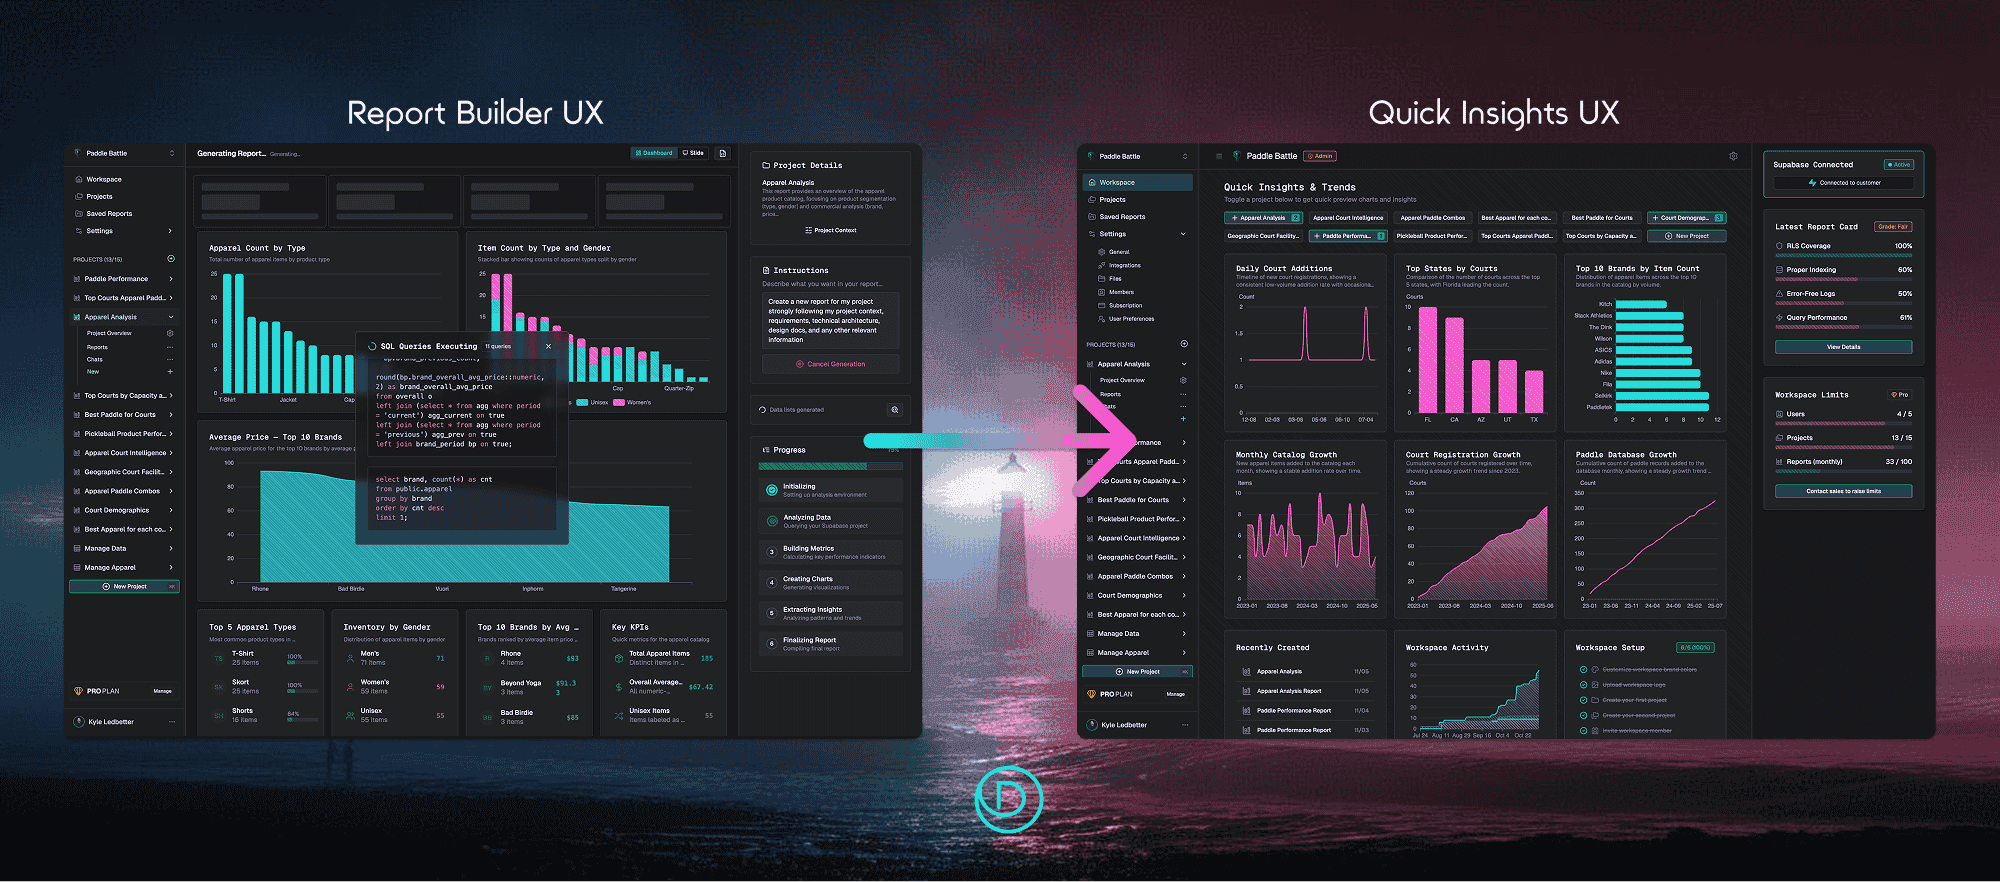
As much of an unlock the report builder experience is, we listened to our users and their feedback was clear: they wanted even quicker ways to interact with their data to easily see outliers, trends, and patterns in their data. Users don't always need full dashboards and reports for the answers they need, they just want to know the most important things quickly and easily.
Using Existing Project Context to Generate Insights
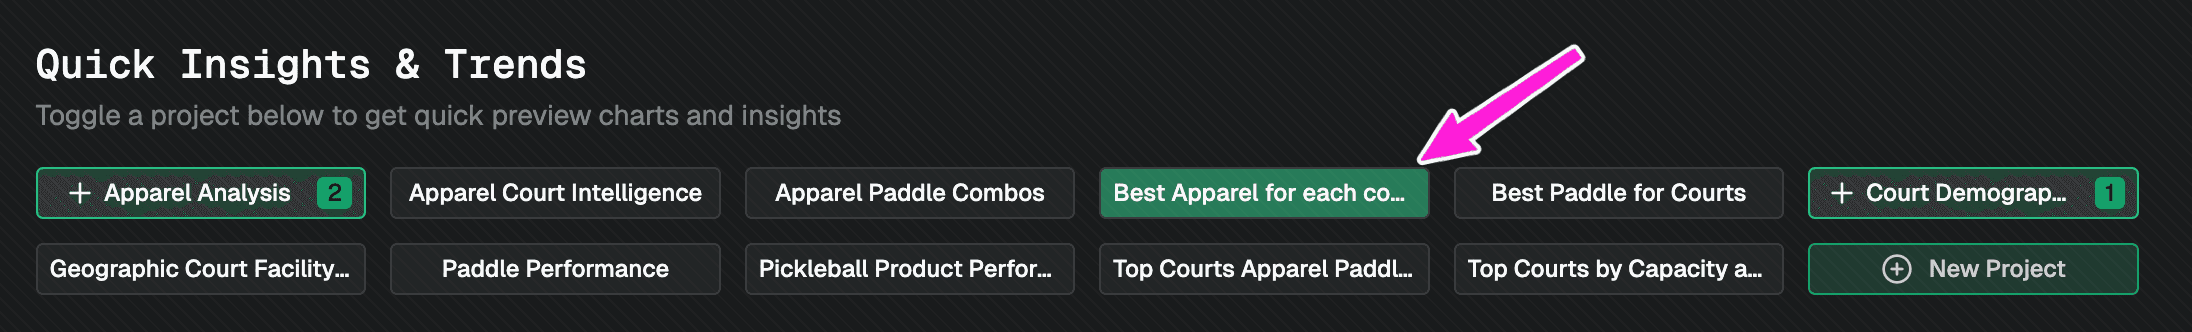
To deliver the same quality and accuracy as our reports, Quick Insights and Trends uses the same project context as our reports to generate insights. This allows us to use the same logic and consistent results, just much faster and easier to use. This is the first step in using your Dreambase projects as topics and KPIs from which you run your business.
Quick Chart Features
When you hover over a quick chart, you will see a few features:
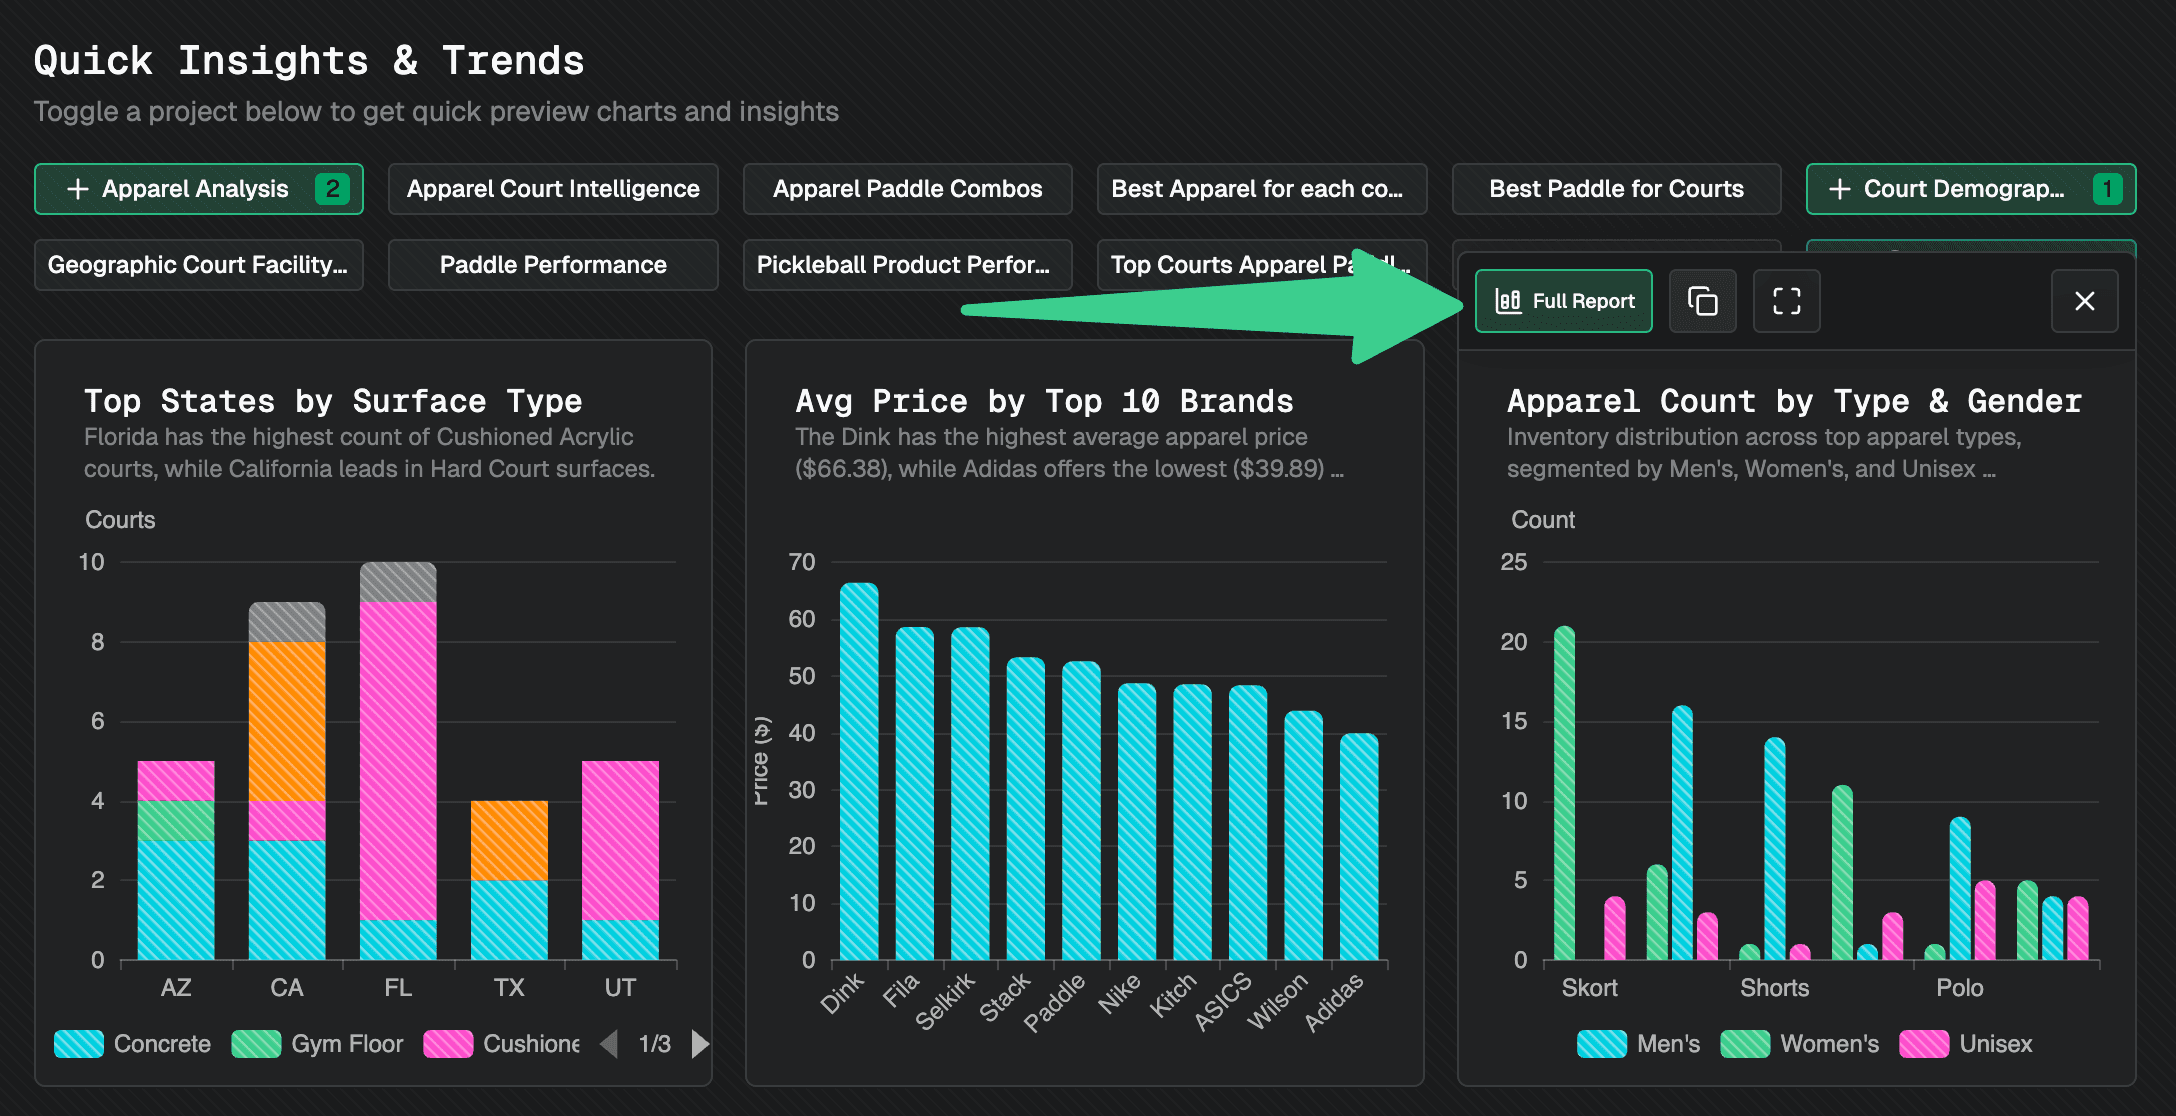
Copy Chart: Copy the chart to your clipboard
Maximize Chart: Maximize the chart to a full screen view
Remove Chart: Remove the chart from the list
Create Full Report: Create a full blown product analytics report from the chart
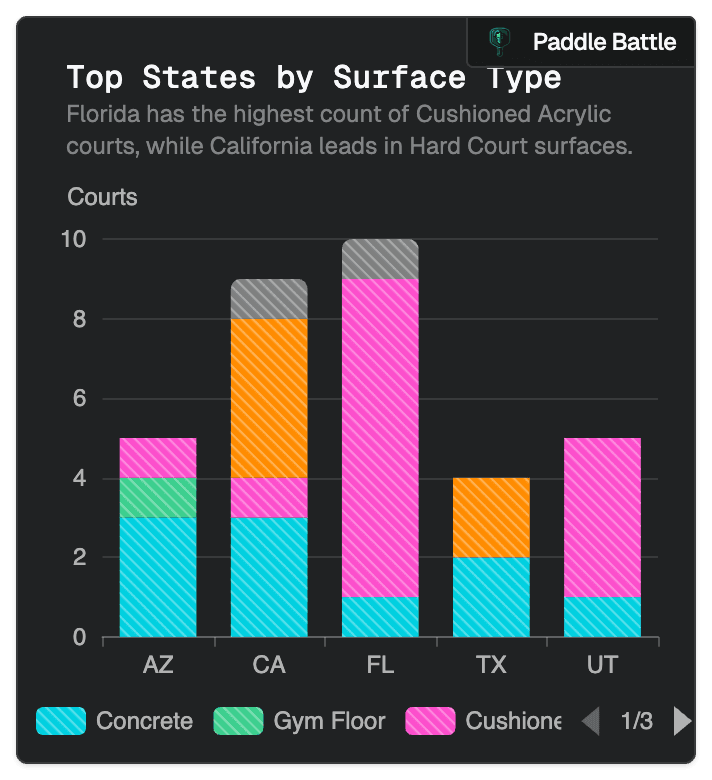
Copy a Chart to Share
Clicking the copy button will copy a PNG of the chart to your clipboard to share in email, slack, or chats.
ProTip: Free accounts use the Dreambase logo, upgrade to include your own logo in the screenshot
Creating Charts from Supabase has never been easier
Building on our existing onboarding experience, which only takes around 3 clicks and 30 seconds to completely integrate into their Supabase project, we're thrilled to keep pushing the envelope and deliver such a powerful feature which is near instantaneous and requires a single click to get insights.
Your new home, the completely revamped Dreambase Workspace Overview
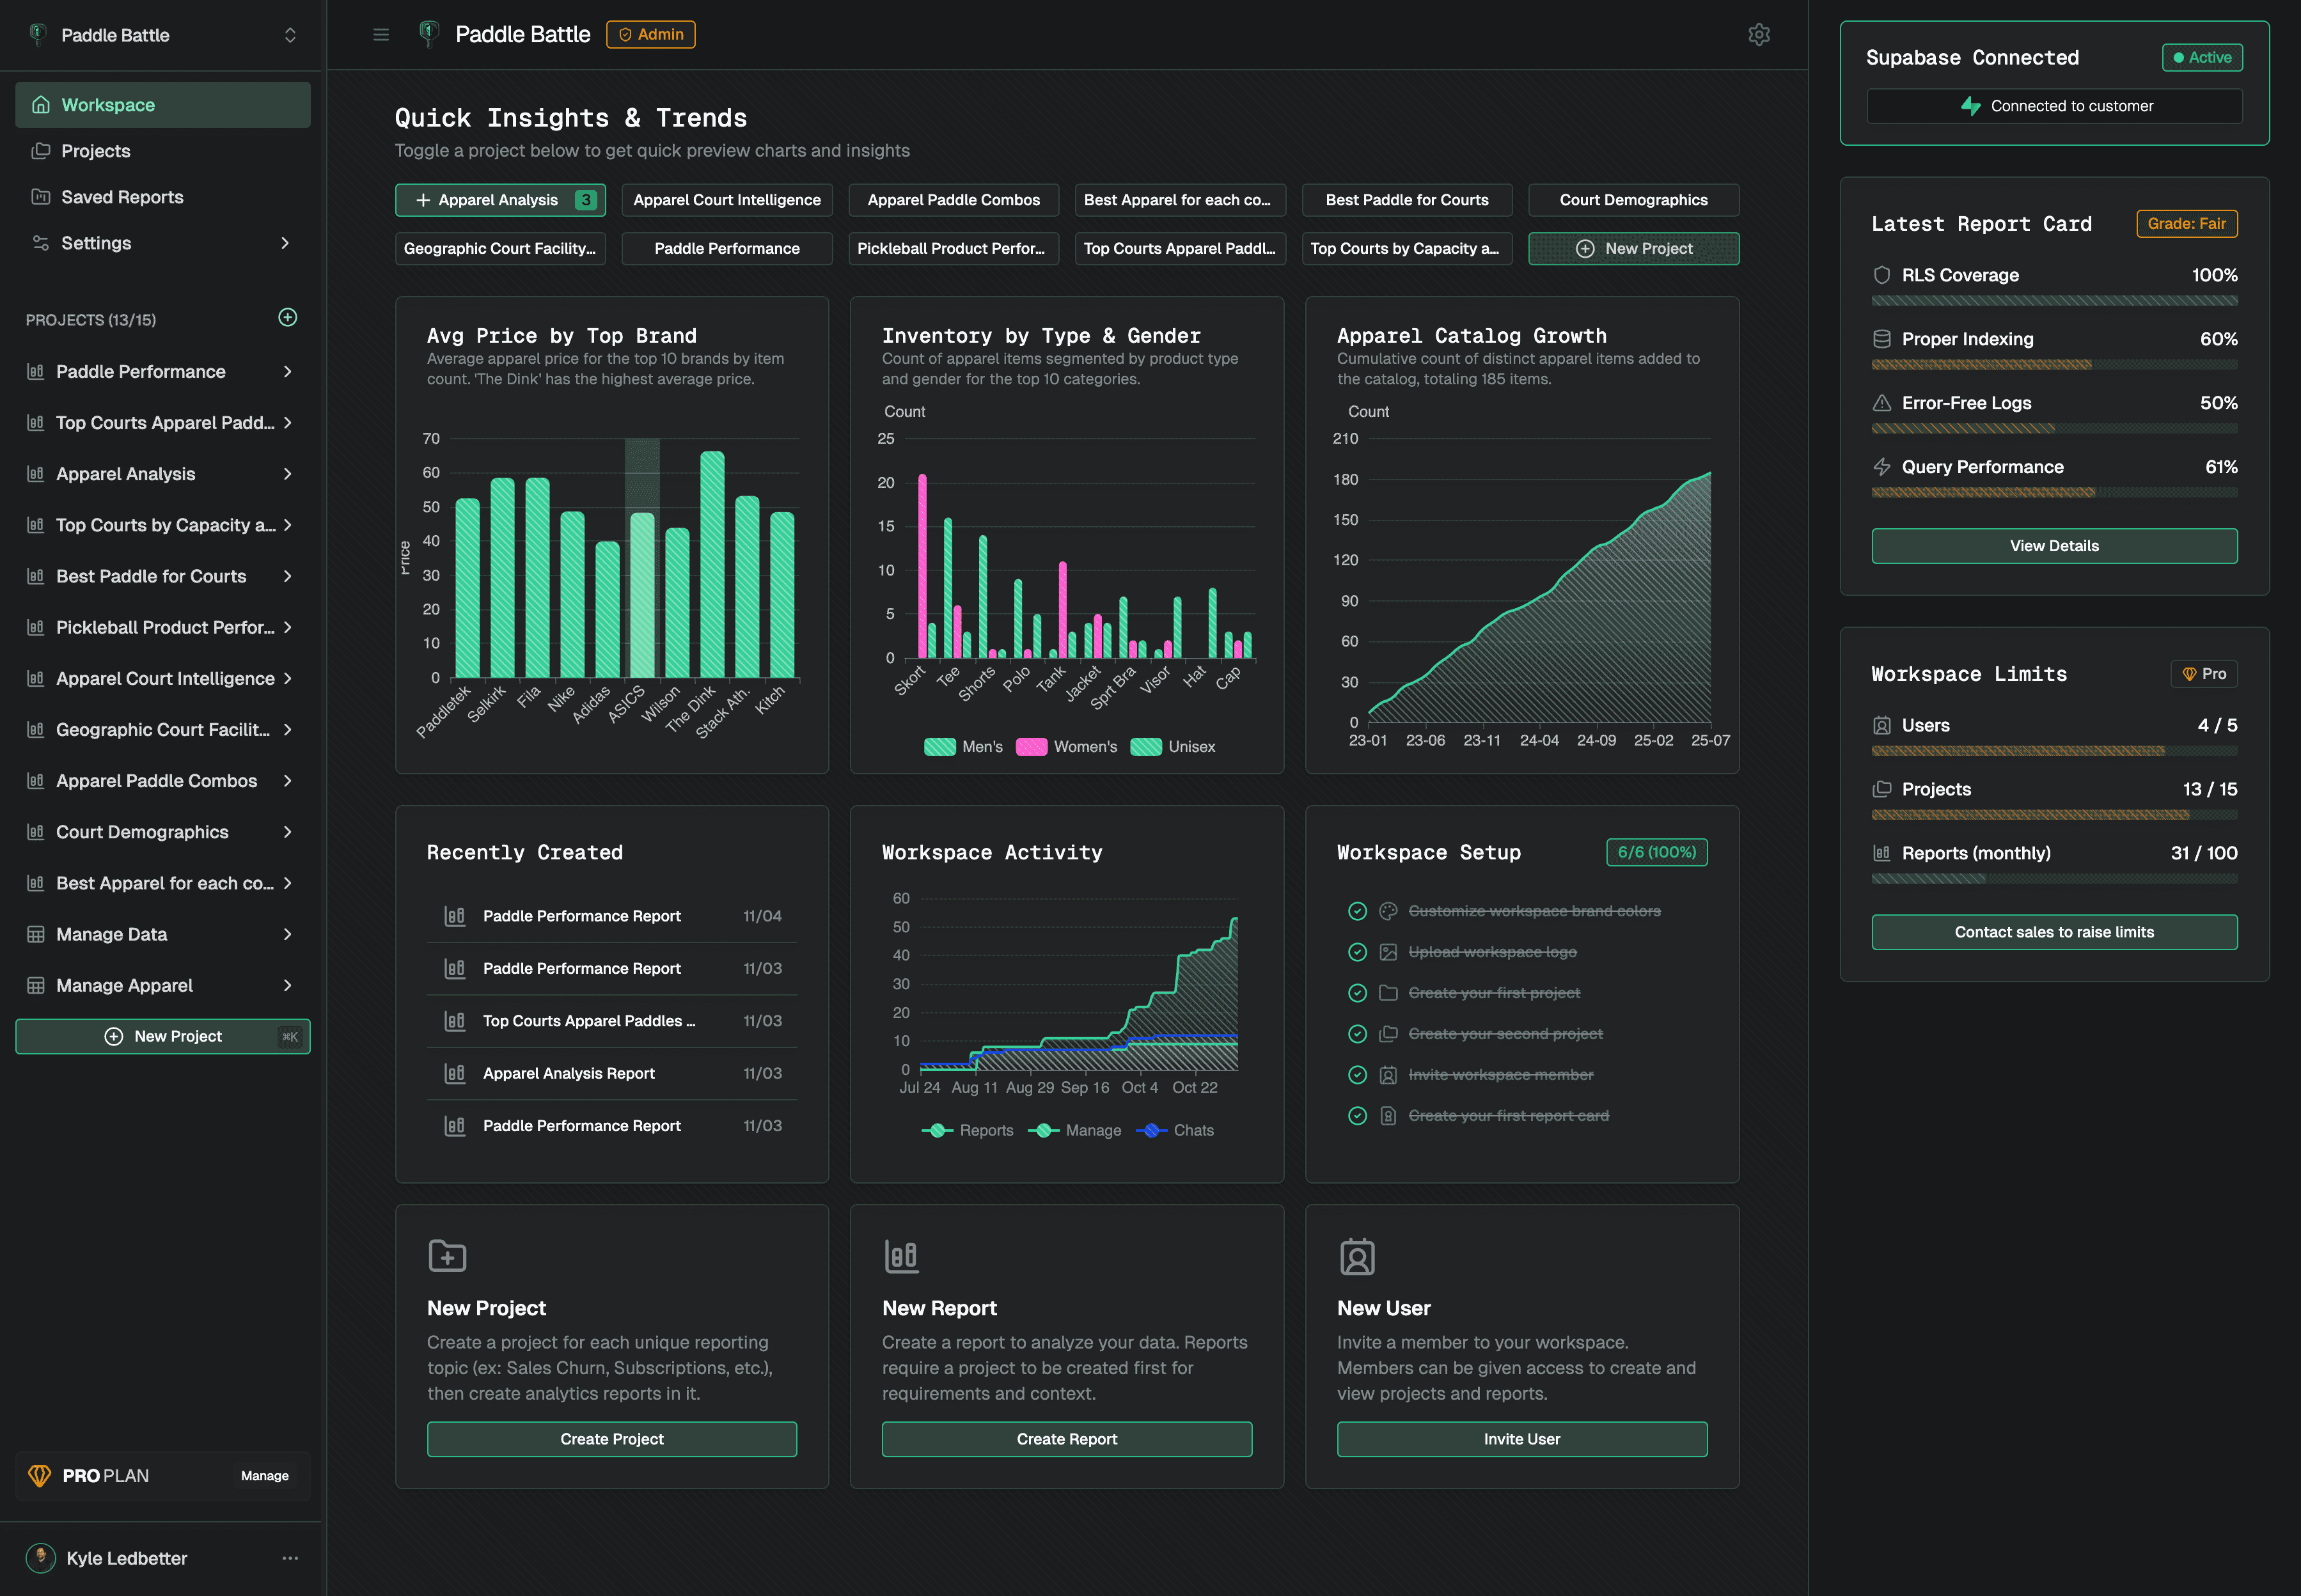
We'll keep evolving and building new AI-driven experiences that allow our users to interact with their data in new and exciting ways, removing the need for traditional analytics tools and patterns.
Ready to witness a new world in AI-native analytics where YOU take the driver's seat?


