Dashboards are the most powerful flagship feature in Dreambase. You will learn how to quickly and easily select topics from the data dictionary to rapidly generate a production quality dashboard which is completely editable an refreshable to fetch new data on demand or on a schedule.
Creating Dashboards with Topics
We highly recommend using Topics from the Data Dictionary when creating dashboards. Topics ensure high-level context and accuracy for your AI-generated analytics.
What are Topics?
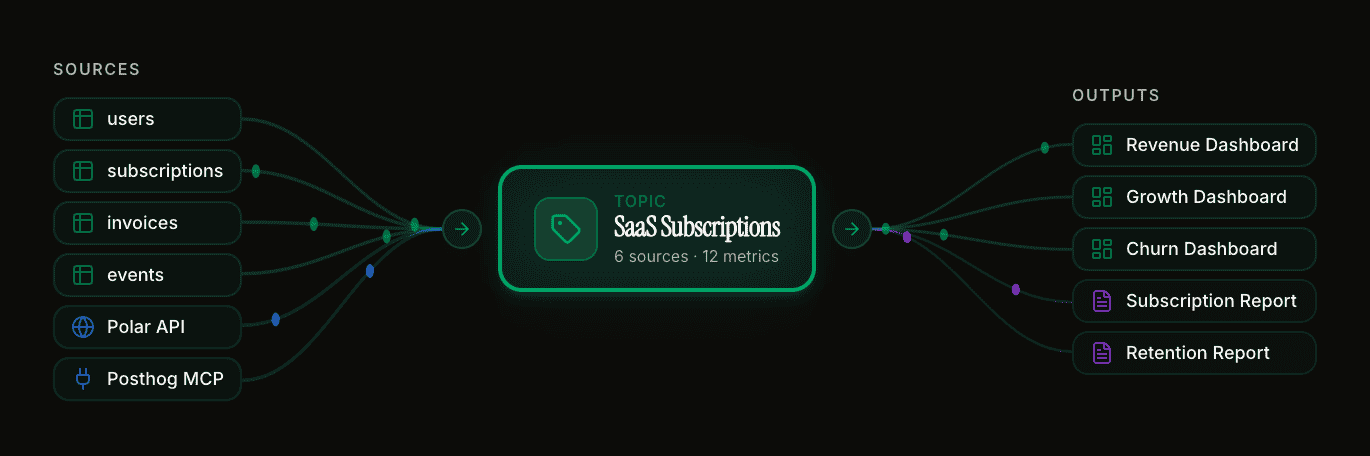
Topics are your AI-native semantic layer. Think of them as KPIs, metrics, and important business concepts mapped to your Supabase tables and columns.
Instead of teaching the AI about your data model every time you create a dashboard, you define Topics once and reuse them across all your dashboards and reports.
Example Topics:
Subscription metrics (MRR, churn rate, active subscribers)
Revenue tracking (total revenue, revenue by product, growth rate)
Product catalog (SKUs, categories, inventory levels)
User engagement (active users, session duration, feature usage)
Creating Your First Topics
We help you create your first Topics during the updated onboarding experience. You can always add more Topics later from the Data Dictionary.
Creating a Dashboard with Topics
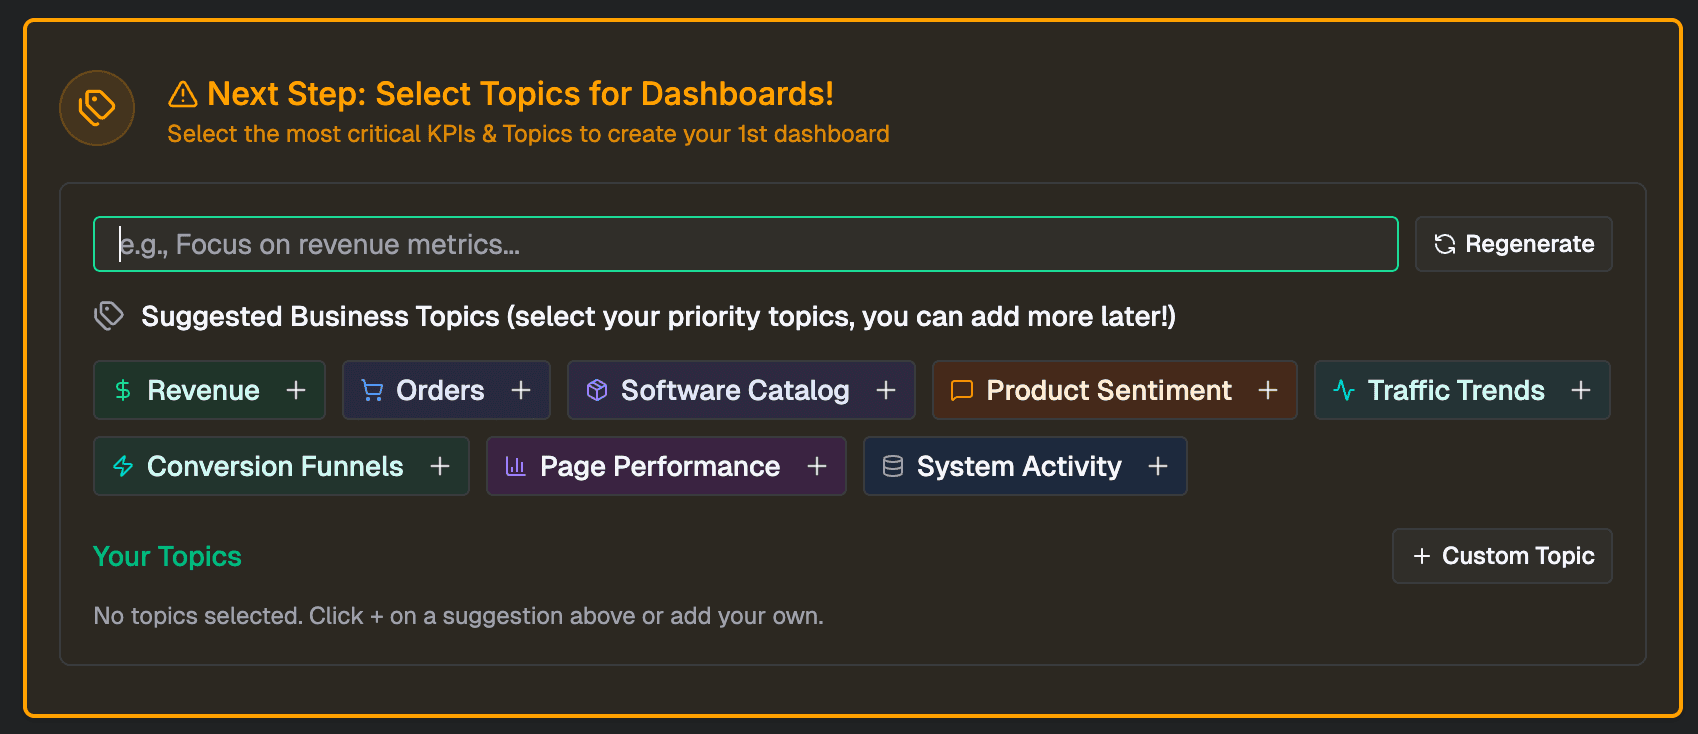
1. Select Your Topics
Choose one or more Topics that relate to what you want to visualize. You can combine multiple Topics for intelligent, comprehensive dashboards.
For example, select "Subscription" and "Revenue" Topics to create a dashboard that shows how subscription changes impact revenue.

2. Write a Short Prompt
After selecting your Topics, write a short prompt describing what you want to see. The AI assistant will use your selected Topics plus your prompt to generate the dashboard.
Example prompts:
"Show me monthly subscription trends and revenue breakdown by plan"
"Create an overview of product catalog performance with top sellers"
"Build a user engagement dashboard with daily active users and feature adoption"
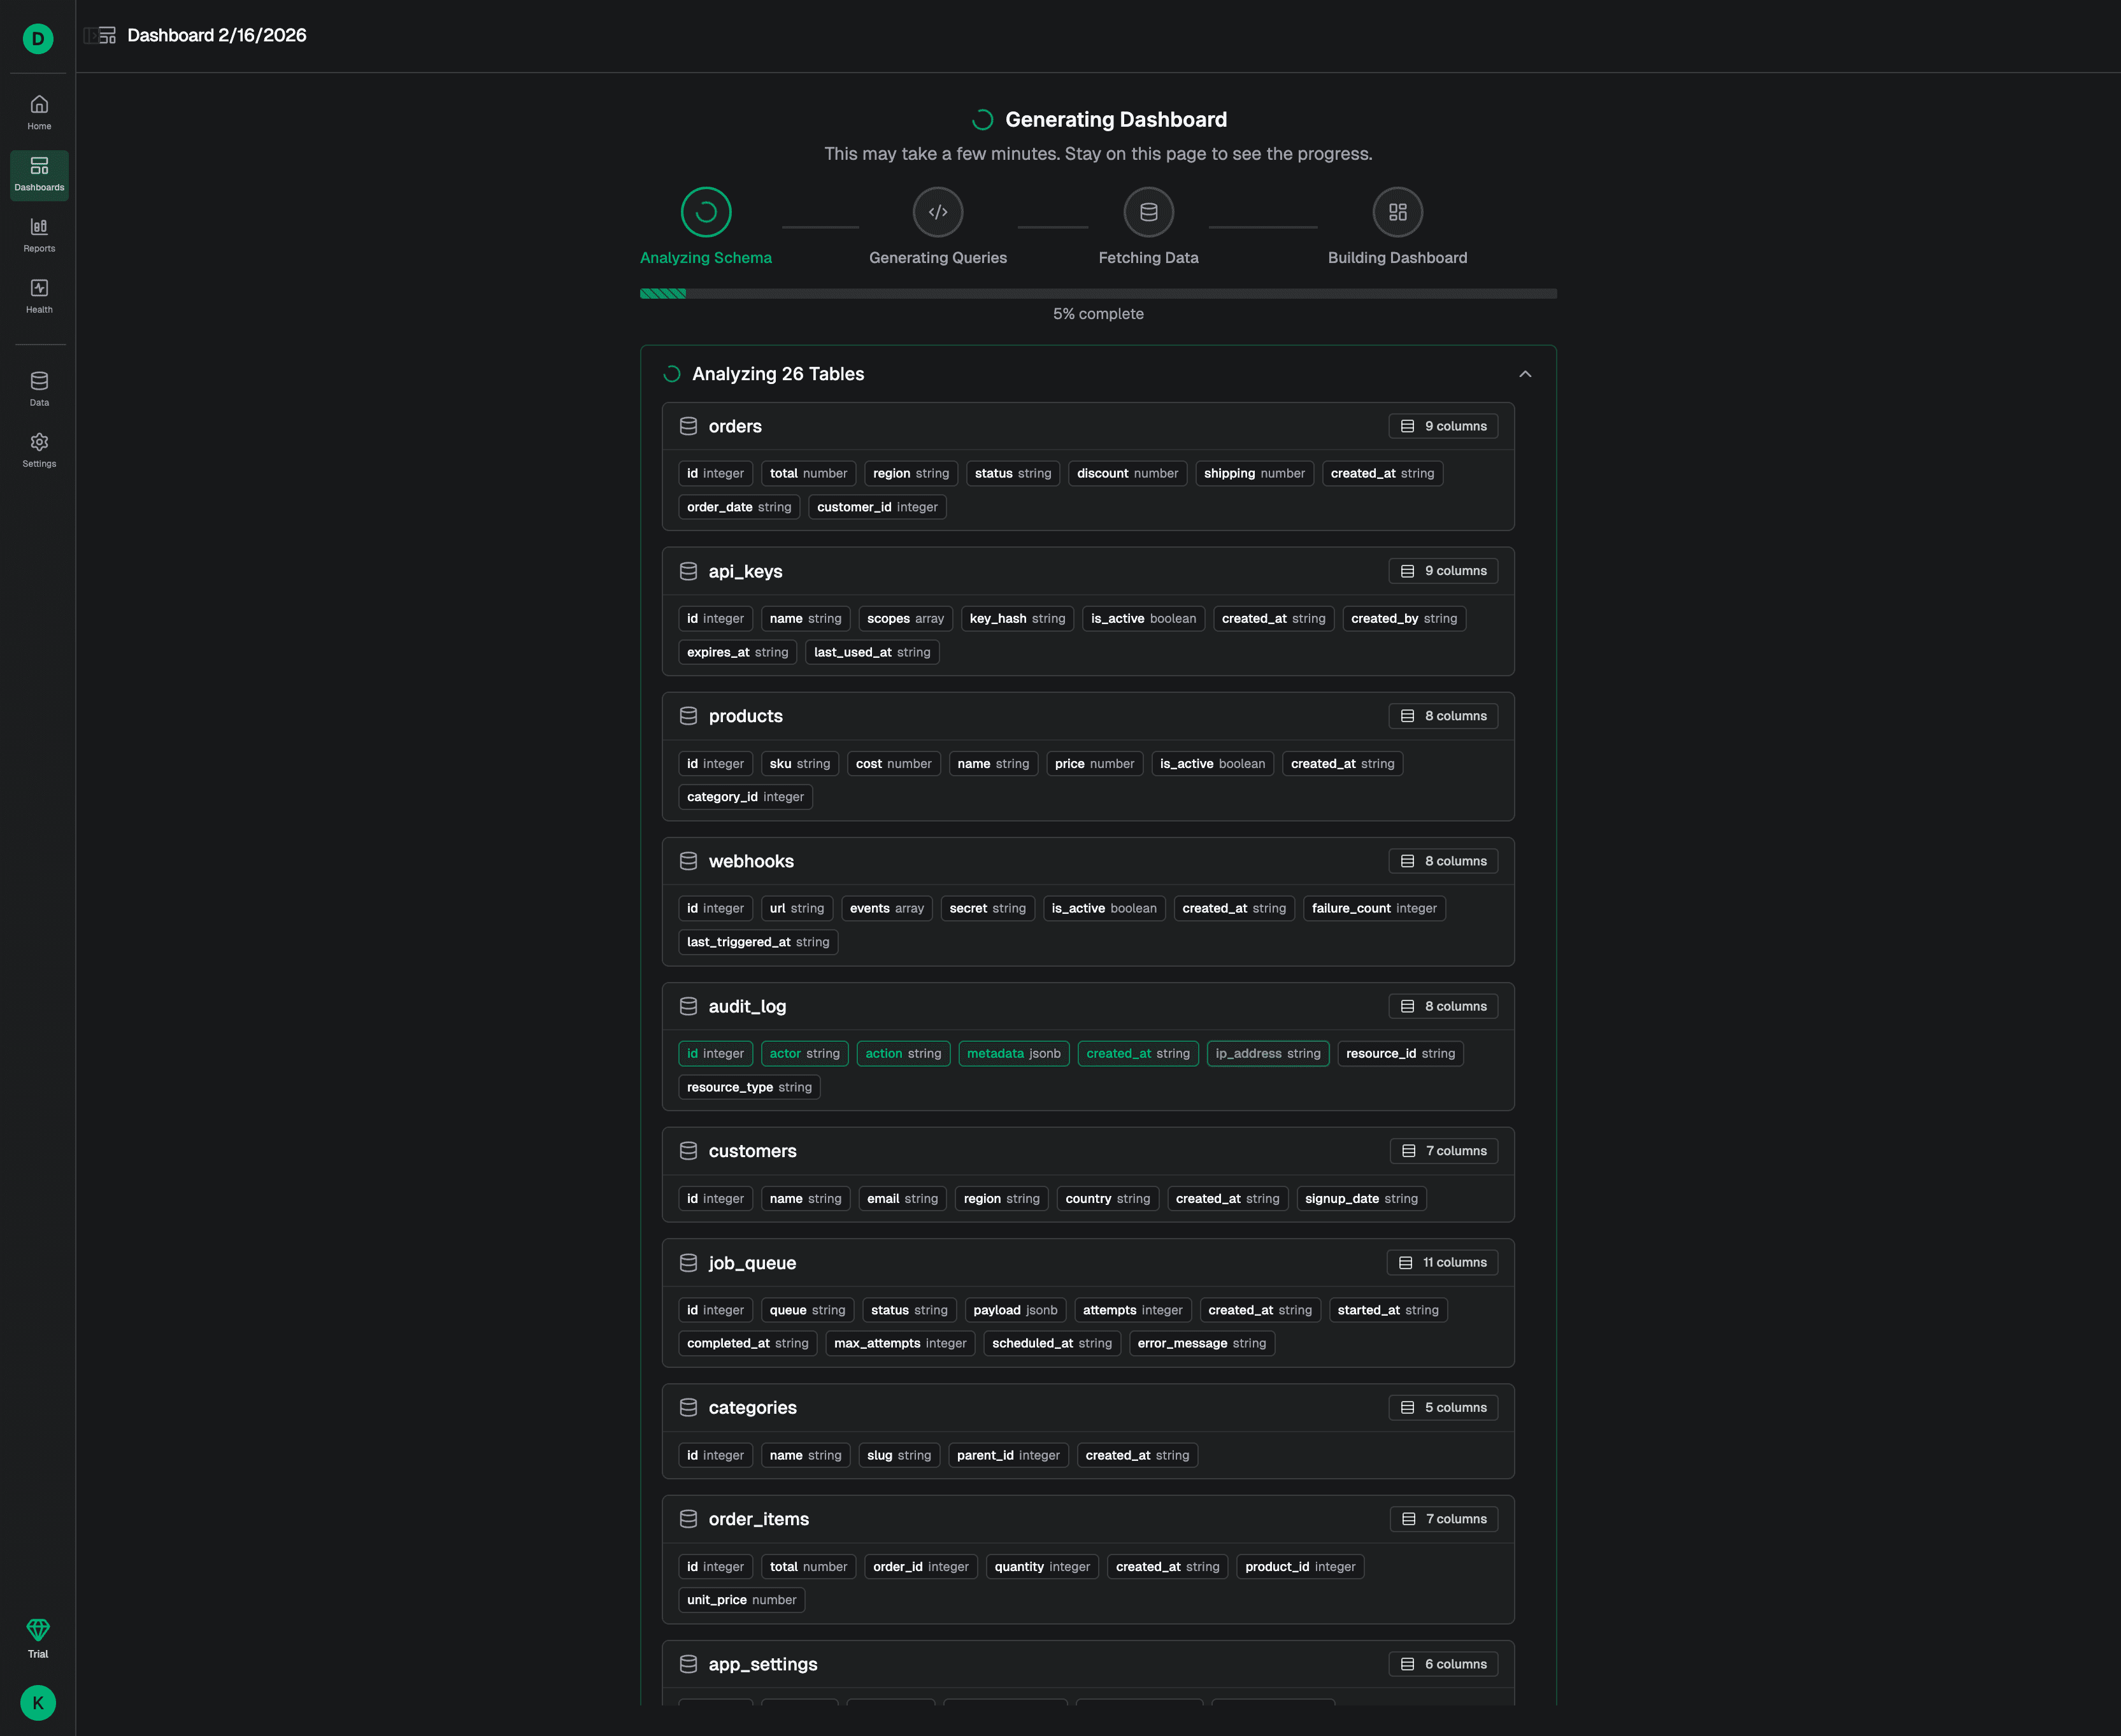
3. Background Generation
Your dashboard will generate in the background. You can safely close the page or tab and return when it's completed. We'll notify you when it's ready.
Editing Your Dashboard
Once generated, you have two ways to refine your dashboard:
Drag-and-Drop Edit Mode
Switch to edit mode for a visual, drag-and-drop experience. Easily:
Resize and rearrange components
Add or remove metrics and charts
Adjust layouts and styling
AI Assistant Refinement
Talk to the AI assistant to modify the dashboard or gather more data. The refinement experience includes shortcuts and commands:
Slash commands (/): Quick actions and common modifications
At commands (@): Reference other Topics, dashboard items, or tables in your database
Example refinement prompts:
"Add a chart showing daily signups for the last 30 days"
"Change the revenue chart to a bar chart grouped by month"
"Include a table with the top 10 products by revenue"
Dashboard Components
Dashboards support a wide variety of flexible components:
Metrics: Single-value KPIs with optional trend indicators
Charts: Line charts, bar charts, pie charts, area charts, and more
Lists: Flexible lists with sorting and filtering
Data Tables: Full tables with pagination, search, and export
Links: Reference other dashboards or external resources
All components can pull from one or multiple data sources and respect your Topic definitions.
Data Refresh and Caching
Dashboards use an intelligent caching system to optimize performance and respect your production database.
How It Works
When a dashboard refreshes, query results are saved as datasets directly in your Supabase Storage. This cache is secure and controlled by you.
Subsequent dashboard loads read from the cached dataset instead of hitting your production database every time. This means:
Faster dashboard load times
Lower costs
No performance impact on your production workload
Refresh Options
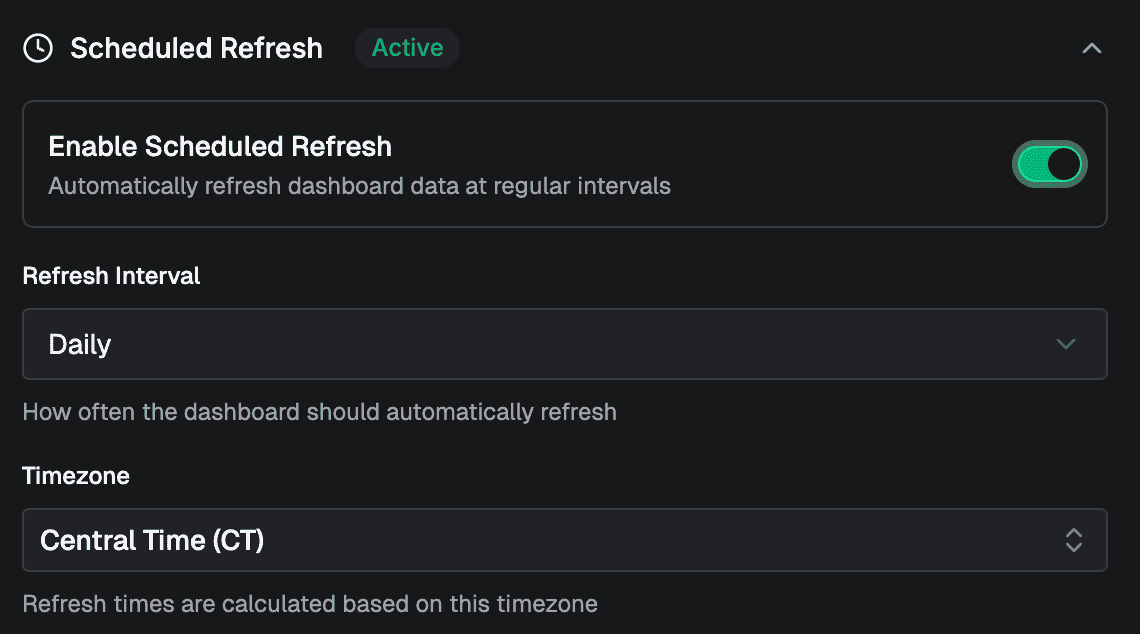
Manual refresh: Click the refresh button anytime to update dashboard data
Scheduled refresh: Set up automatic refresh on a schedule you control (hourly, daily, weekly, etc.)
The choice is yours. We respect your database by not hitting it unnecessarily.
Dashboard Management
Pinning Dashboards
Pin important dashboards to your homepage for quick access. Pinned dashboards appear at the top of your dashboard list.
Grid and List Views
View your dashboards in a powerful grid or list layout with:
Search across dashboard names and descriptions
Filters by Topic, created date, or custom tags
Sort by name, last modified, or custom order
Best Practices
Start with Topics: Always use Topics when creating dashboards. The AI generates more accurate queries and maintains consistency across your analytics.
Combine related Topics: Use multiple Topics together for comprehensive dashboards that show how different areas of your business connect.
Set appropriate refresh schedules: Match refresh frequency to your data update patterns. Real-time data might refresh hourly, while monthly reports can refresh daily.
Use the AI assistant iteratively: Don't expect perfection on the first generation. Refine with the AI assistant to get exactly what you need.
Pin your most important dashboards: Keep critical metrics one click away on your homepage.
© 2025 Dream, Inc. All rights reserved.