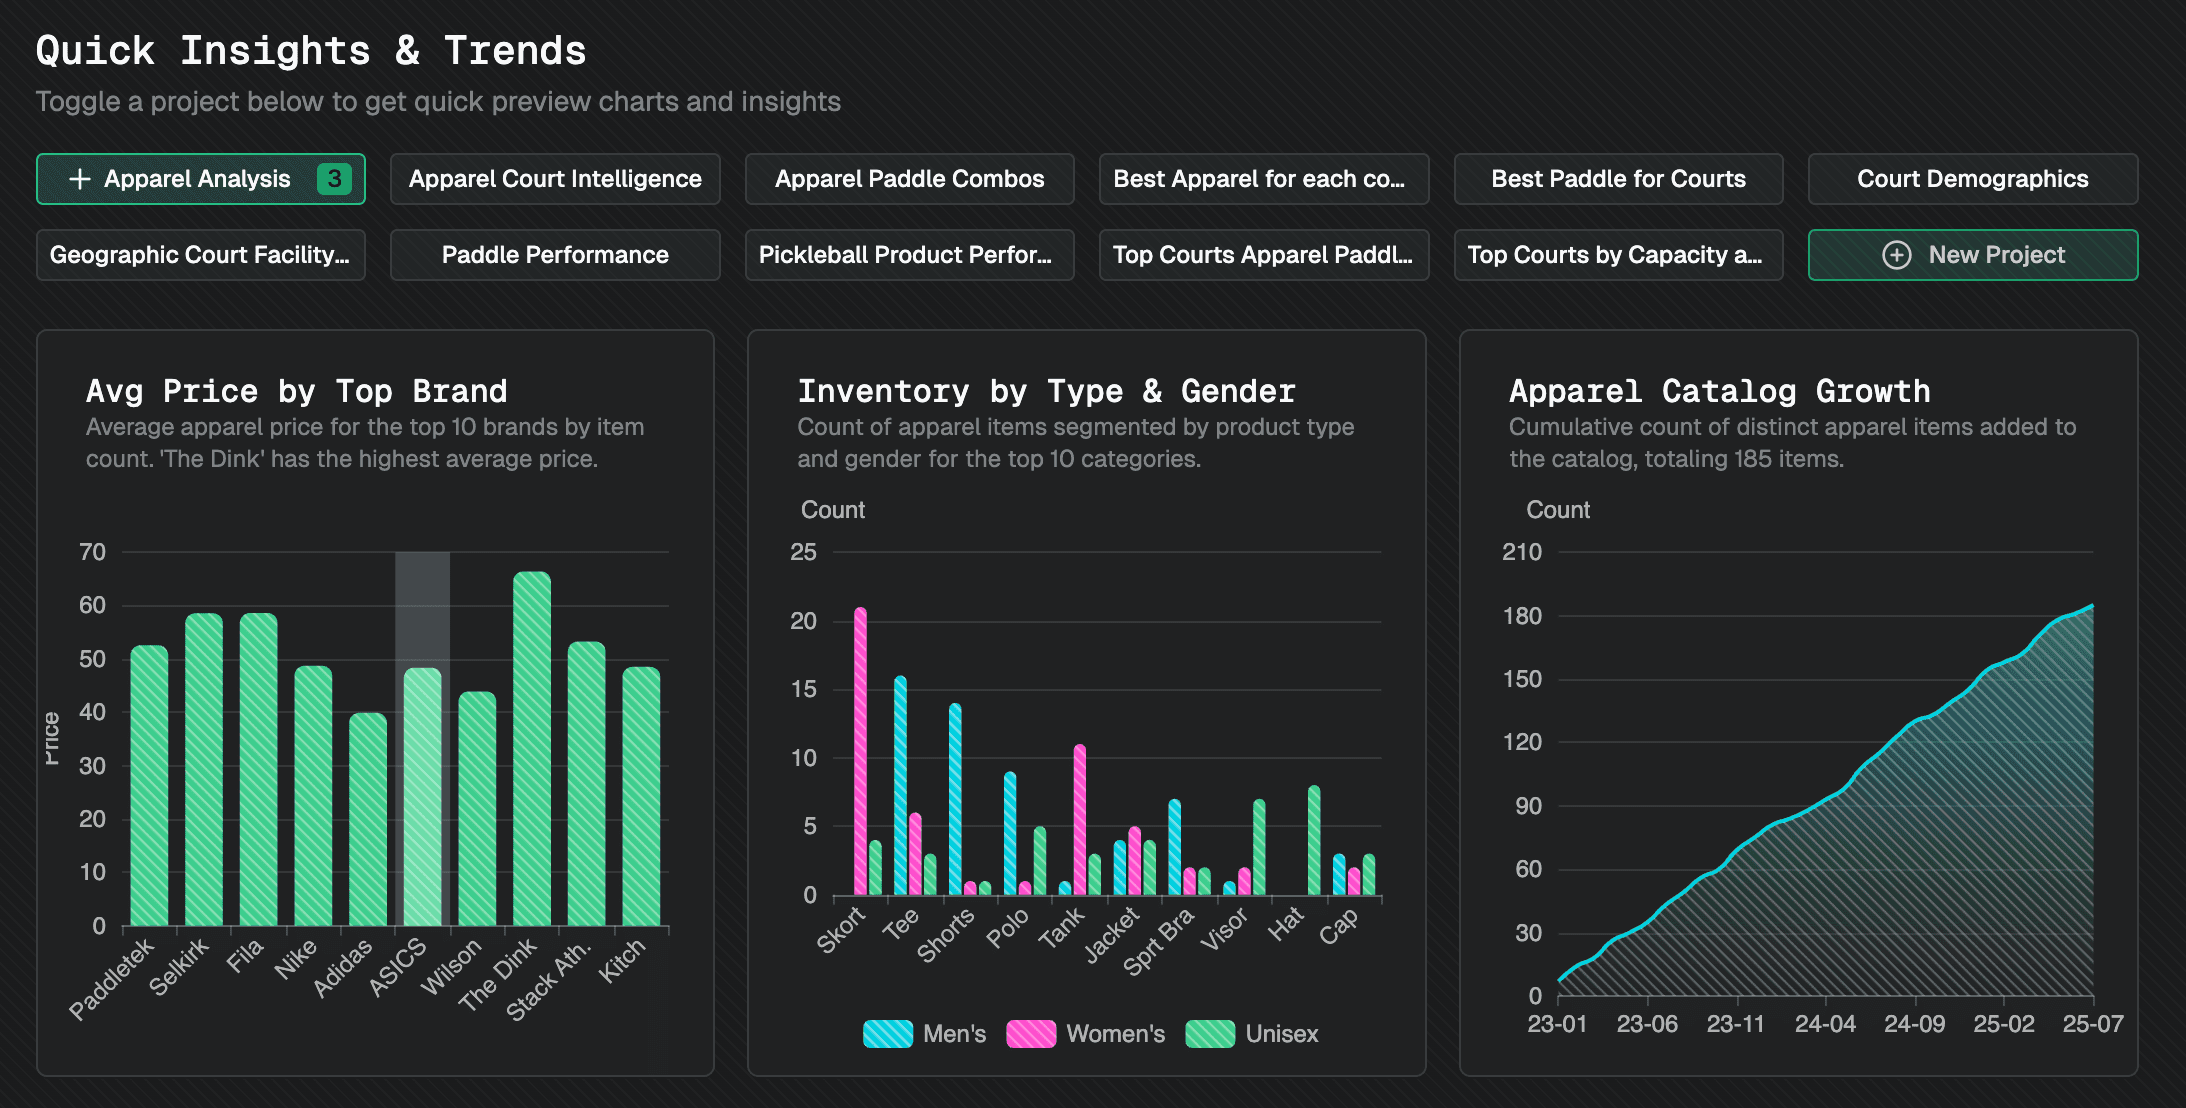
Once you've added one or more Projects, you'll be able to easily create charts directly from your Workspace Overview with a single click for quick insights.
Quick Insights and Trends is an all new incredibly powerful feature that allows you to generate insights and trends in seconds directly from their Supabase data in their Dreambase dashboard. It will change the way your interact with your data by surfacing the most important metrics and trends in your data, allowing you to quickly understand the health and performance of your business and drill down into the details of any metric or trend for a full blown product analytics report.
Prerequisites
Since Quick Insights and Trends uses the same project context as our reports, you need to have at least one project context set up in your Dreambase workspace. You can set up your project context in the Project Overview page.
Generate Quick Insights
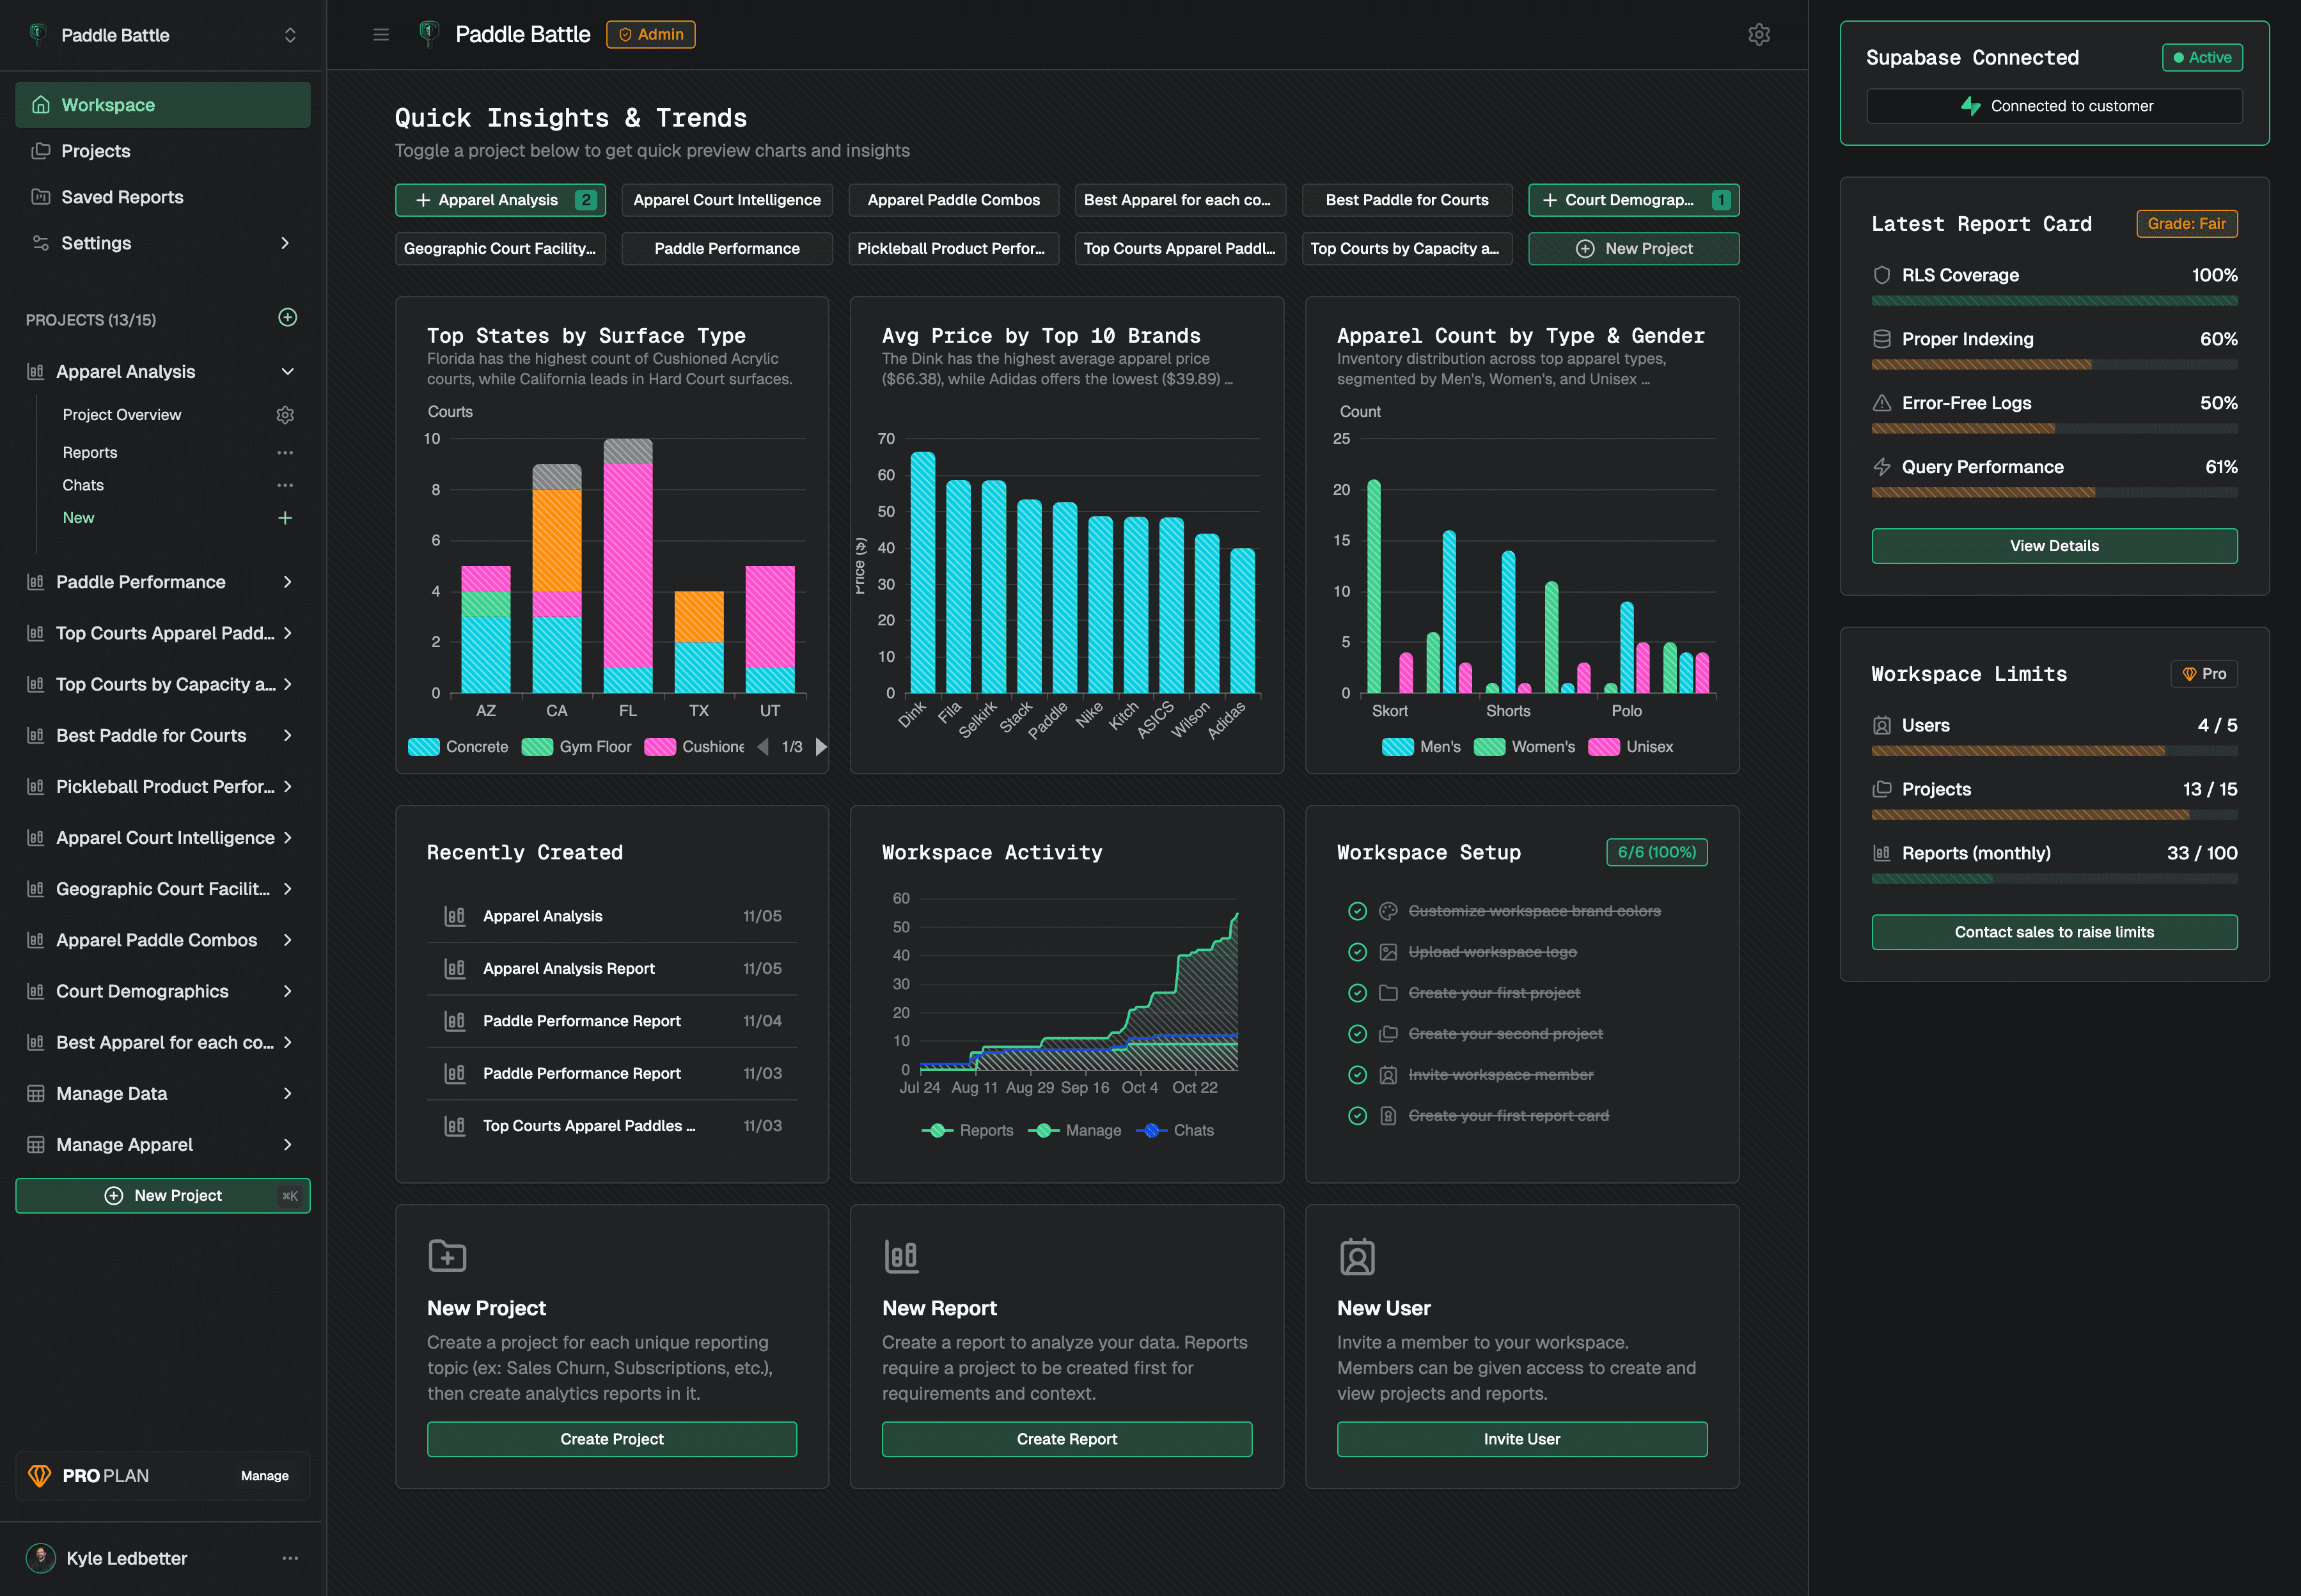
Quick Insights are available in your Workspace Overview. Users in your workspace can click any Project name to generate quick insights and trends, which will generate three charts at a time. The user can keep clicking the project name to continue generating three charts at a time. Keep clicking other project names to generate more insights and trends in batches of three charts at a time.
Quick Chart Features
When you hover over a quick chart, you will see a few features:
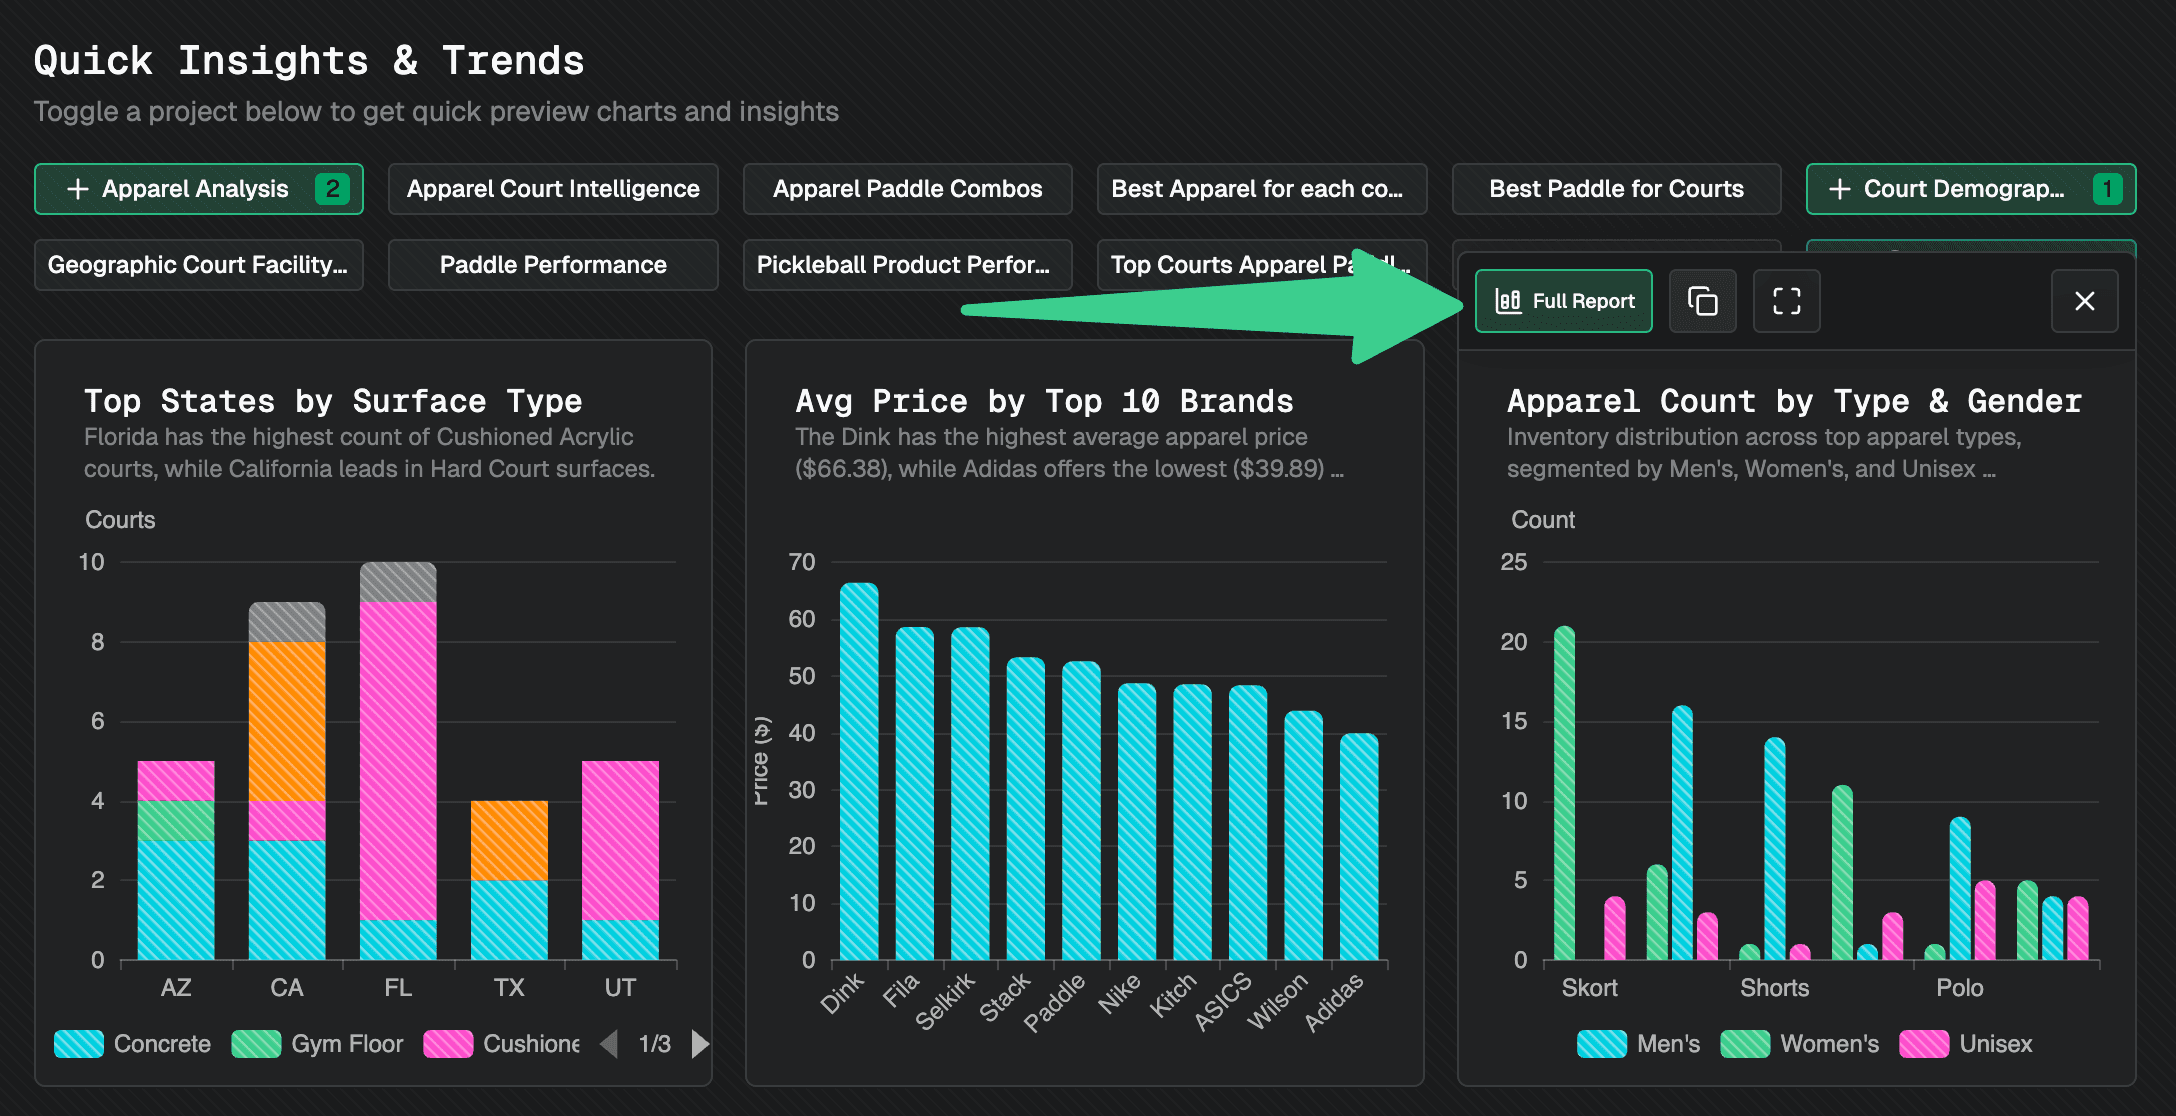
Copy Chart: Copy the chart to your clipboard
Maximize Chart: Maximize the chart to a full screen view
Remove Chart: Remove the chart from the list
Create Full Report: Create a full blown product analytics report from the chart
Copy a Chart to Share
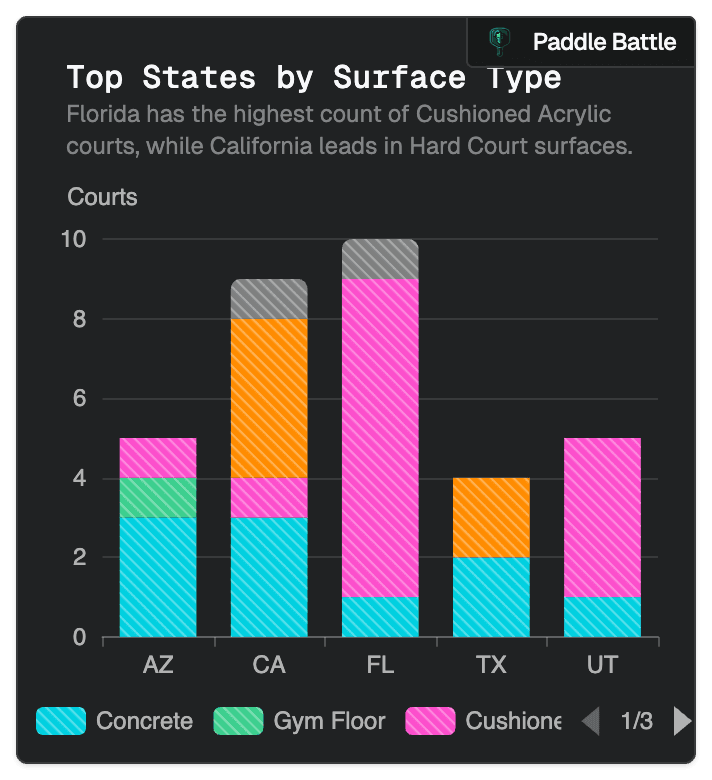
Clicking the copy button will copy a PNG of the chart to your clipboard to share in email, slack, or chats.
ProTip: Free accounts use the Dreambase logo, upgrade to include your own logo in the screenshot
Quick Chart Context
Quick charts are generated using the same logic as our reports, but much faster and easier to use. They are generated using the same project context as our reports, and use the same logic and consistent results.
Ephemeral Charts vs Persistent Reports
Quick charts are ephemeral, meaning they are only available for the current session. They are intended to capture a quick insight or trend, not a full blown product analytics report. They are not saved to your Dreambase workspace and will be lost when you close your browser, unlike reports which are saved to your Dreambase workspace and can be accessed later.
© 2025 Dream, Inc. All rights reserved.